UNITED STATES
SECURITIES AND EXCHANGE COMMISSION
WASHINGTON, D.C. 20549
FORM 10-K
| |
þ | ANNUAL REPORT PURSUANT TO SECTION 13 OR 15(d) OF THE SECURITIES EXCHANGE ACT OF 1934 |
For the fiscal year ended December 31, 2018
OR
| |
o | TRANSITION REPORT PURSUANT TO SECTION 13 OR 15(d) OF THE SECURITIES EXCHANGE ACT OF 1934 |
For the transition period from to
Commission file number 001-38432
Wyndham Hotels & Resorts, Inc.
(Exact Name of Registrant as Specified in Its Charter) |
| | |
Delaware | | 82-3356232 |
(State or Other Jurisdiction of Incorporation or Organization) | | (I.R.S. Employer Identification No.) |
| | |
22 Sylvan Way | | 07054 |
Parsippany, New Jersey | | (Zip Code) |
(Address of Principal Executive Offices) | | |
(973) 753-6000
(Registrant’s Telephone Number, Including Area Code)
Securities registered pursuant to Section 12(b) of the Act:
|
| | |
Title of each Class | | Name of each exchange on which registered |
Common Stock, Par Value $0.01 per share | | New York Stock Exchange |
Securities registered pursuant to Section 12(g) of the Act:
None
(Title of Class)
Indicate by check mark if the registrant is a well-known seasoned issuer, as defined in Rule 405 of the Securities Act. Yes o No þ
Indicate by check mark if the registrant is not required to file reports pursuant to Section 13 or Section 15(d) of the Act. Yes o No þ
Indicate by check mark whether the registrant: (1) has filed all reports required to be filed by Section 13 or 15(d) of the Securities Exchange Act of 1934 during the preceding 12 months (or for such shorter period that the registrant was required to file such reports), and (2) has been subject to such filing requirements for the past 90 days. Yes þ No o
Indicate by check mark whether the registrant has submitted electronically every Interactive Data File required to be submitted pursuant to Rule 405 of Regulation S-T (§232.405 of this chapter) during the preceding 12 months (or for such shorter period that the registrant was required to submit such files). Yes þ No o
Indicate by check mark if disclosure of delinquent filers pursuant to Item 405 of Regulation S-K (§229.405) is not contained herein, and will not be contained, to the best of registrant’s knowledge, in definitive proxy or information statements incorporated by reference in Part III of this Form 10-K or any amendment to this Form 10-K. þ
Indicate by check mark whether the registrant is a large accelerated filer, an accelerated filer, a non-accelerated filer, smaller reporting company, or an emerging growth company. See the definitions of “large accelerated filer,” “accelerated filer,” “smaller reporting company,” and “emerging growth company” in Rule 12b-2 of the Exchange Act. (Check one):
|
| | | | | | | |
Large accelerated filer | o | | | | | Accelerated filer | o |
Non-accelerated filer | þ | | | | | Smaller reporting company | o |
| | | | | | Emerging growth company | o |
If an emerging growth company, indicate by check mark if the registrant has elected not to use the extended transition period for complying with any new or revised financial accounting standards provided pursuant to Section 13(a) of the Act. o
Indicate by check mark whether the registrant is a shell company (as defined in Rule 12b-2 of the Exchange Act). Yes o No þ
The aggregate market value of the registrant’s common stock held by non-affiliates of the registrant as of June 30, 2018, was $5,789,872,286. All executive officers and directors of the registrant have been deemed, solely for the purpose of the foregoing calculation, to be “affiliates” of the registrant.
As of January 31, 2019, the registrant had outstanding 97,888,796 shares of common stock.
DOCUMENTS INCORPORATED BY REFERENCE
Portions of the Proxy Statement prepared for the 2019 Annual Meeting of Shareholders are incorporated by reference into Part III of this report.
TABLE OF CONTENTS
|
| | |
| | Page |
| PART I | |
Item 1. | | |
Item 1A. | | |
Item 1B. | | |
Item 2. | | |
Item 3. | | |
Item 4. | | |
| | |
| PART II | |
Item 5. | | |
Item 6. | | |
Item 7. | | |
Item 7A. | | |
Item 8. | | |
Item 9. | | |
Item 9A. | | |
Item 9B. | | |
| | |
| PART III | |
Item 10. | | |
Item 11. | | |
Item 12. | | |
Item 13. | | |
Item 14. | | |
| | |
| PART IV | |
Item 15. | | |
Item 16. | | |
| | |
PART I
Forward-Looking Statements
This report contains forward-looking statements within the meaning of Section 21E of the Securities Exchange Act of 1934, as amended. These statements include, but are not limited to, statements related to our expectations regarding our strategy and the performance of our business, our financial results, our liquidity and capital resources and other non-historical statements. Forward-looking statements include those that convey management’s expectations as to the future based on plans, estimates and projections and may be identified by words such as “will,” “expect,” “believe,” “plan,” “anticipate,” “intend,” “goal,” “future,” “outlook,” “guidance,” “target,” “objective,” “estimate” and similar words or expressions, including the negative version of such words and expressions. Such forward-looking statements involve known and unknown risks, uncertainties and other factors, which may cause the actual results, performance or achievements of Wyndham Hotels to be materially different from any future results, performance or achievements expressed or implied by such forward-looking statements.
You are cautioned not to place undue reliance on these forward-looking statements, which speak only as of the date of this report. Factors that could cause actual results to differ materially from those in the forward-looking statements include without limitation general economic conditions, the performance of the financial and credit markets, the economic environment for the hospitality industry, operating risks associated with the hotel franchising and management businesses, the impact of war, terrorist activity or political strife, risks related to our spin-off as a newly independent company and risks related to our ability to obtain financing as well as the risks described under Part I, Item 1A - Risk Factors. Except as required by law, Wyndham Hotels undertakes no obligation to publicly update or revise any forward-looking statements, whether as a result of new information, subsequent events or otherwise.
Where You Can Find More Information
We file annual, quarterly and current reports, proxy statements, reports filed or furnished pursuant to Section 13(a) or 15(d) of the Securities Exchange Act of 1934 and other information with the Securities Exchange Commission (“SEC”). Our SEC filings are available free of charge to the public over the Internet at the SEC’s website at https://www.sec.gov. Our SEC filings are also available on our website at https://www.wyndhamhotels.com as soon as reasonably practicable after they are filed with or furnished to the SEC. We maintain an internet site at https://www.wyndhamhotels.com. Our website and the information contained on or connected to that site are not incorporated into this Annual Report.
Item 1. Business.
OUR BUSINESS
Wyndham Hotels & Resorts, Inc. (“Wyndham Hotels”, the “Company”, or “we”) is the world’s largest hotel franchisor, with nearly 9,200 affiliated hotels located in over 80 countries. We license our 20 renowned hotel brands to franchisees, who pay us royalty and other fees to use our brands and services. We are the leader in the economy and midscale segments and have a growing presence in the upscale segment of the global hotel industry. We have grown our franchised hotel portfolio over time both organically and through acquisitions, and we have a robust pipeline of hotel owners and developers who have executed franchise agreements for our brands. Wyndham Hotels became an independent public company in May 2018 when it was spun-off from Wyndham Worldwide Corporation (“former Parent”). In 2018, Wyndham Hotels generated revenues of $1,868 million, net income of $162 million and Adjusted EBITDA of $507 million. (See Item 6. Selected Financial Data for our definition of Adjusted EBITDA and the reconciliation of Net Income to Adjusted EBITDA.)
We enable our franchisees, who range from sole proprietors to public real estate investment trusts, to optimize their return on investment. We drive guest reservations to our franchisees’ properties through strong brand awareness among consumers and businesses, our global reservation system, our award-winning Wyndham Rewards loyalty program and our national, local and global marketing campaigns. We establish brand standards, provide our franchisees with property-based operational training and turn-key technology solutions, and help reduce their costs by leveraging our scale. These capabilities enhance returns for our franchisees and therefore help us to attract and retain franchisees. With over 5,900 franchisees, we have built the largest network of franchisees of any global hotel company.
Our portfolio of global brands enables us to franchise hotels in virtually any market at a range of price points, catering to both our guests’ and franchisees’ preferences. We welcome over 150 million guests annually worldwide. We primarily target economy and midscale guests, as they represent the largest demographic in the United States and around the world. We have
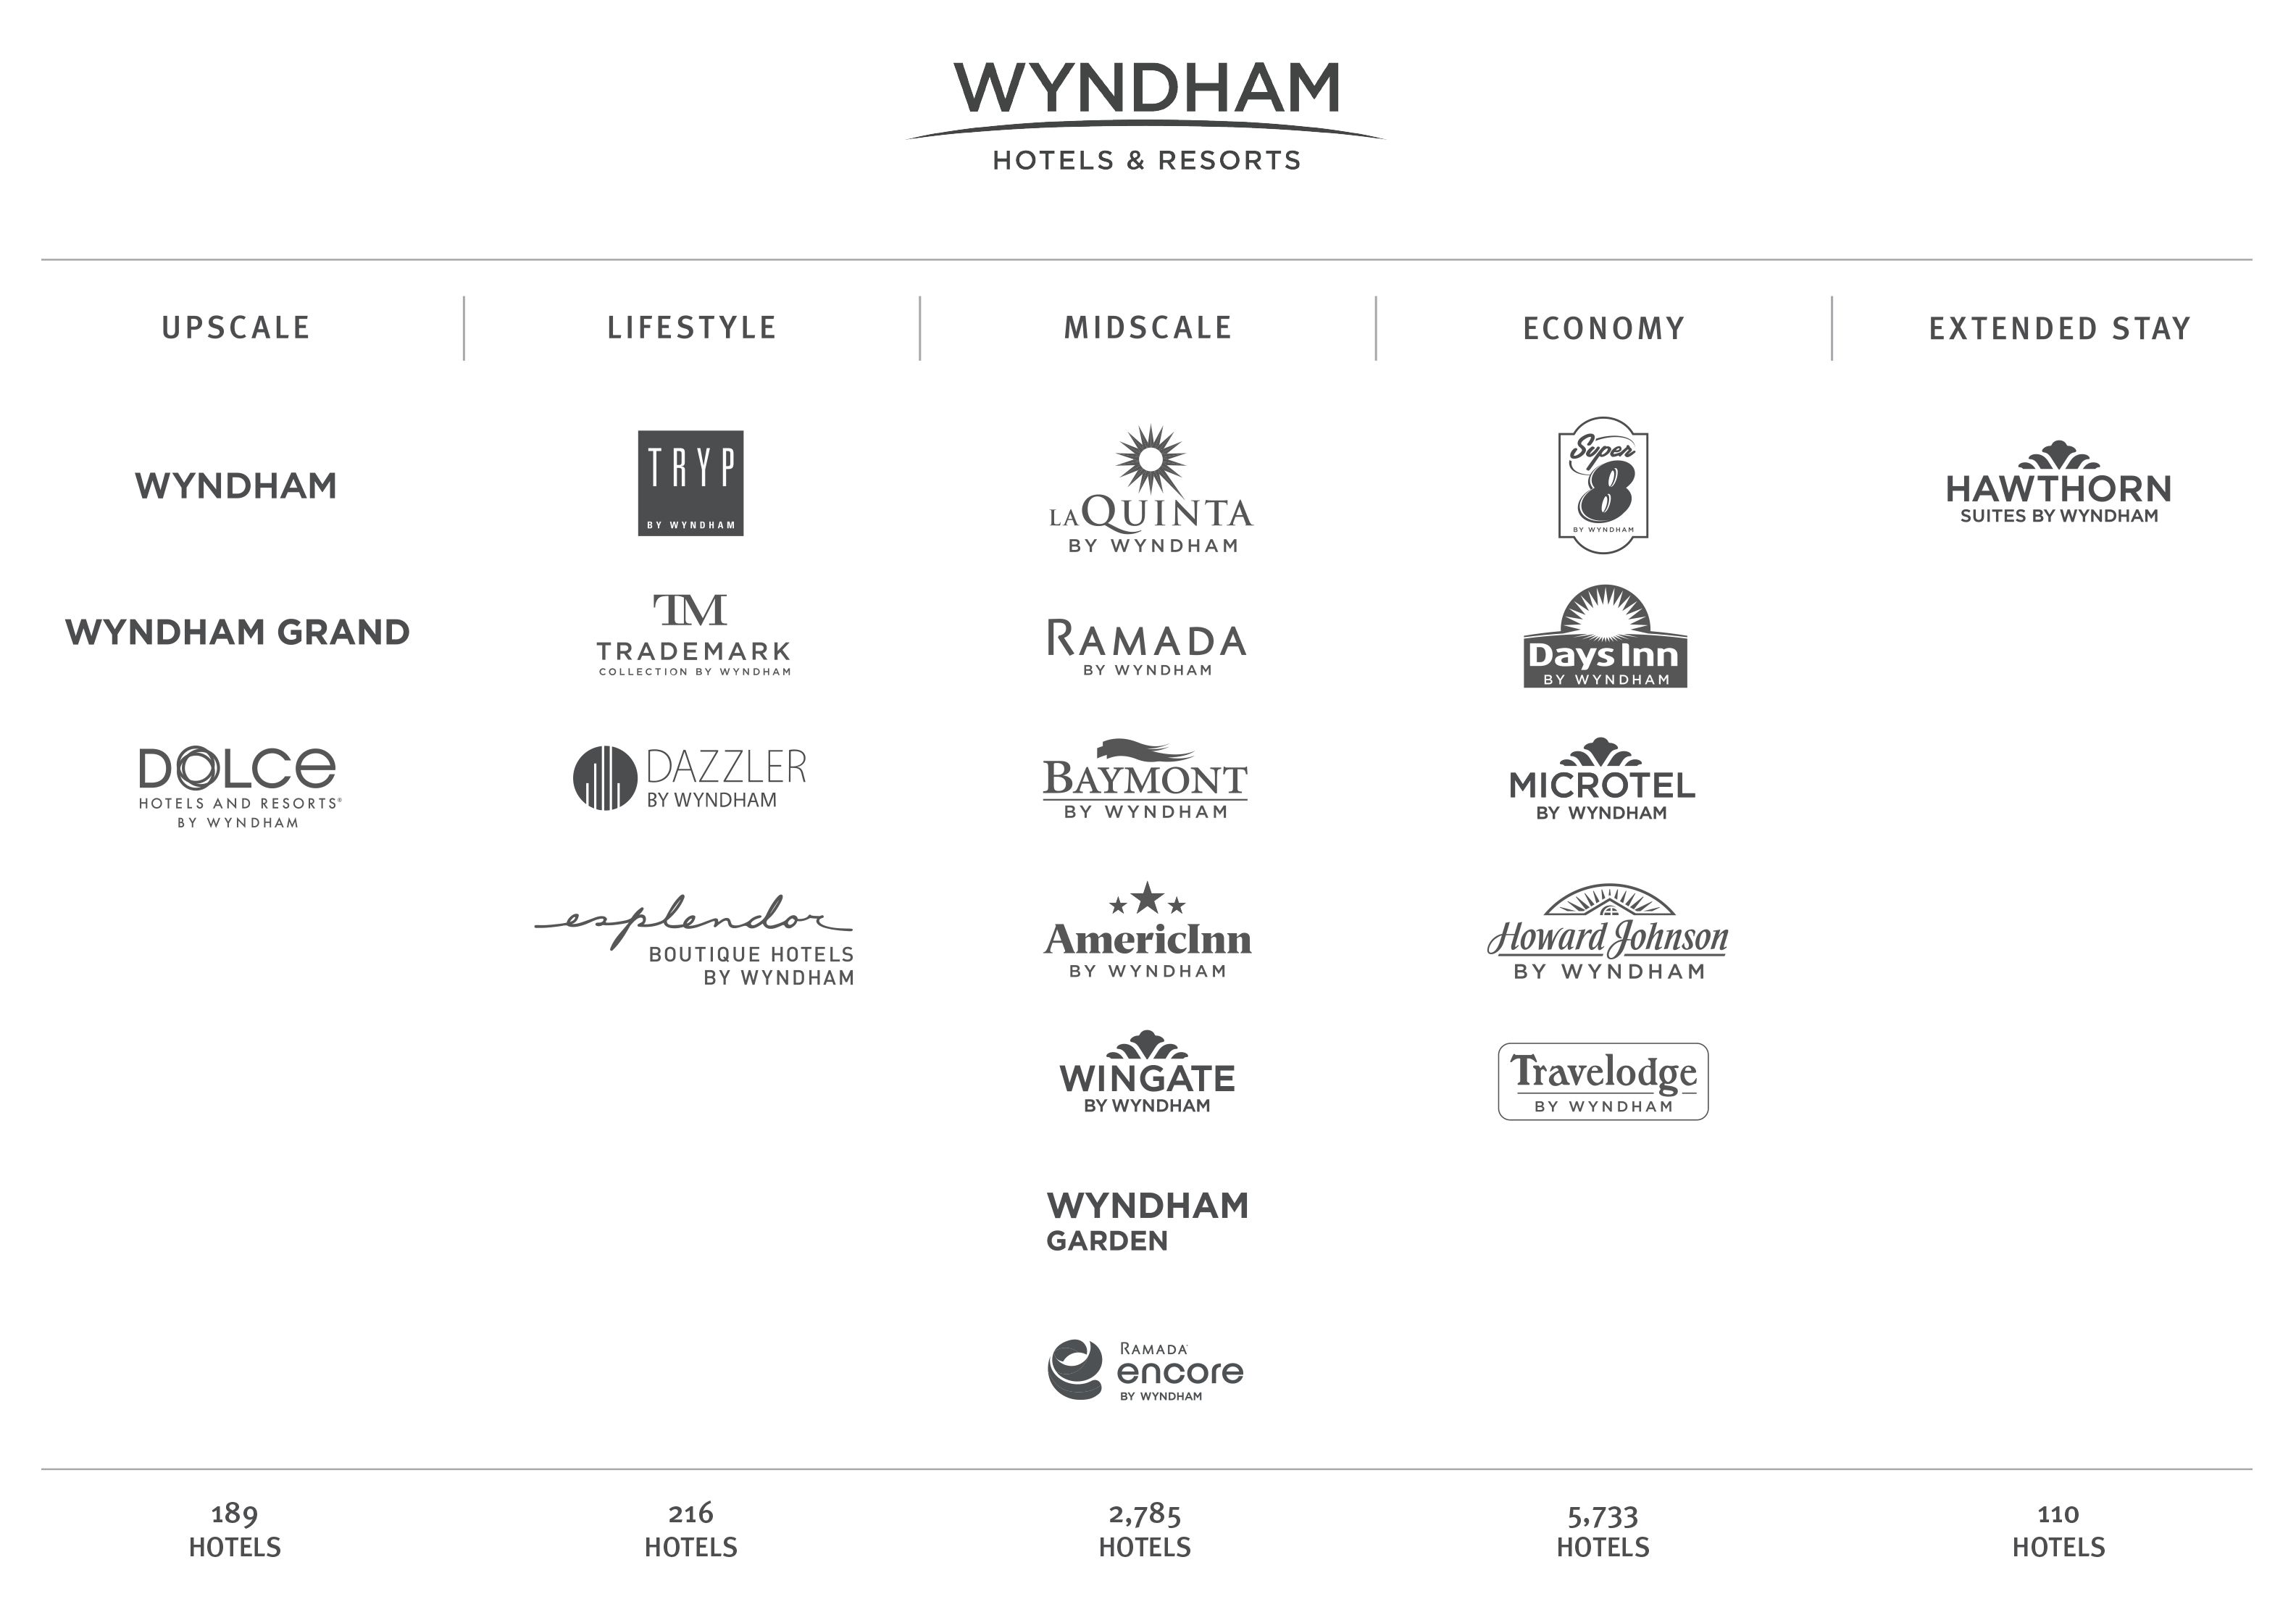
the leading position in the economy and midscale segments of the hotel industry, where our hotel brands represent approximately two of every five branded rooms in the United States. Approximately 70% of the hotels affiliated with our brands are located in the United States and approximately 30% are located internationally. The following table summarizes our brand portfolio as of December 31, 2018:
Our business model is asset-light, as we generally receive a percentage of each franchised hotel’s room revenues but do not own the underlying properties. Our business is adaptable to changing economic environments due to a low operating cost structure, which, together with our recurring fee streams and limited capital expenditures, yields attractive margins and predictable cash flows. Our franchise agreements are typically 10 to 20 years in length, providing significant visibility into future cash flows. Under these agreements, our franchisees pay us royalty fees and marketing and reservation fees, which are based on a percentage of their gross room revenues. We are required to spend marketing and reservation fees on marketing and reservation activities, enabling us to predictably match these expenses with an offsetting revenue stream on an annual basis. We also license the “Wyndham” trademark and certain other trademarks and intellectual property to Wyndham Destinations, Inc. (formerly known as Wyndham Worldwide Corporation) through a long-term license agreement under which we receive royalty fees. In addition to hotel franchising, we are a leading hotel management company. Our portfolio of managed hotels includes 438 third-party-owned properties and two owned properties. Virtually all of the hotels in our system are franchised to third parties, and substantially all of our Adjusted EBITDA is generated by our Hotel Franchising segment.
We pursue multiple avenues of growth to generate returns for our stockholders. We use our scale, brands, guest loyalty, franchisee network and sales capabilities to add new hotels to our system. Our long-established franchising experience and ability to innovate, together with favorable macroeconomic and lodging industry fundamentals, continue to support our organic growth around the world. Additionally, we intend to use our cash flow to continue to return capital to stockholders and to invest in the business and pursue external growth opportunities.
Our Competitive Strengths
We believe our success has been and will be driven by significant competitive strengths that we have developed over time:
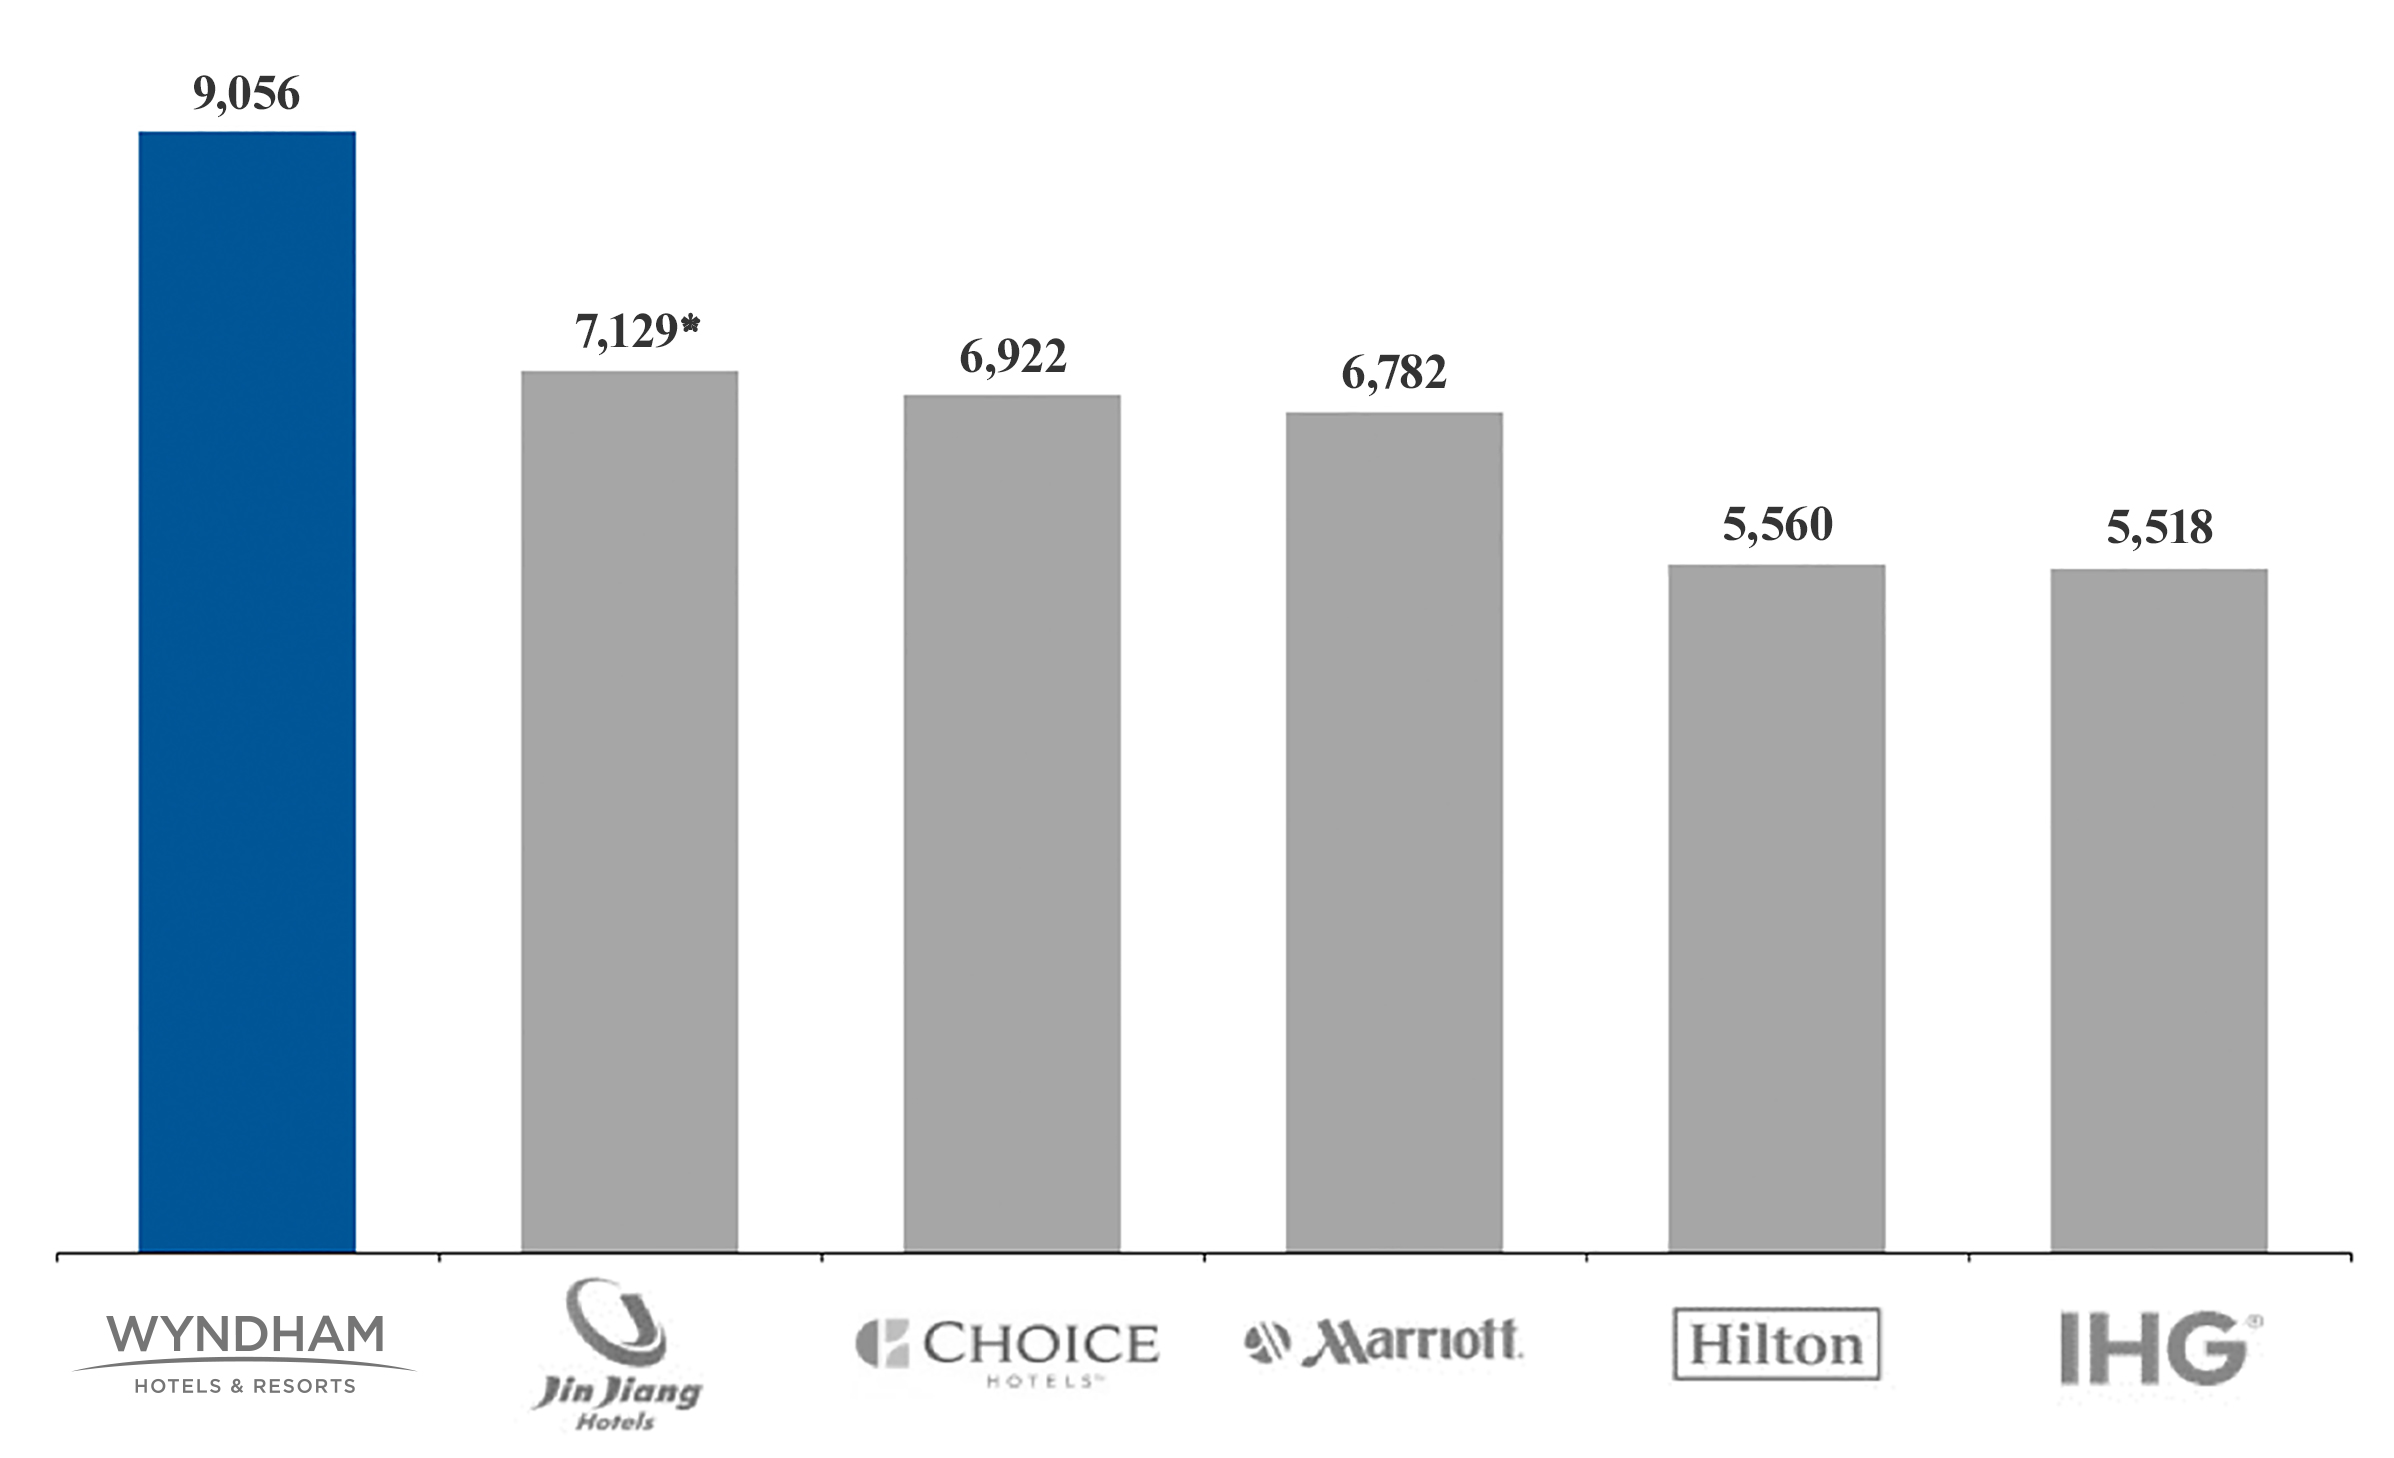
Industry-leading footprint in the hotel industry
Wyndham Hotels is the world’s largest hotel franchisor, with nearly 9,200 affiliated hotels in over 80 countries as of December 31, 2018. Our brands have substantial presence, welcoming over 150 million guests annually worldwide. The following chart presents the number of branded hotels associated with each of the six largest hotel companies:
Global Hotel Companies by Number of Branded Hotels as of September 30, 2018
* As of June 30, 2018.
Source: Companies’ public disclosures.
Our scale enhances brand awareness among consumers and businesses and provides numerous benefits to franchisees. Our global reservation system, extensive distribution network and award-winning Wyndham Rewards program drive over 65 million guest reservations annually to our franchisees. We also help our franchisees reduce overall costs through our marketing campaigns, technology solutions and purchasing programs with third-party suppliers. Our ability to provide these benefits helps us to attract and retain franchisees.
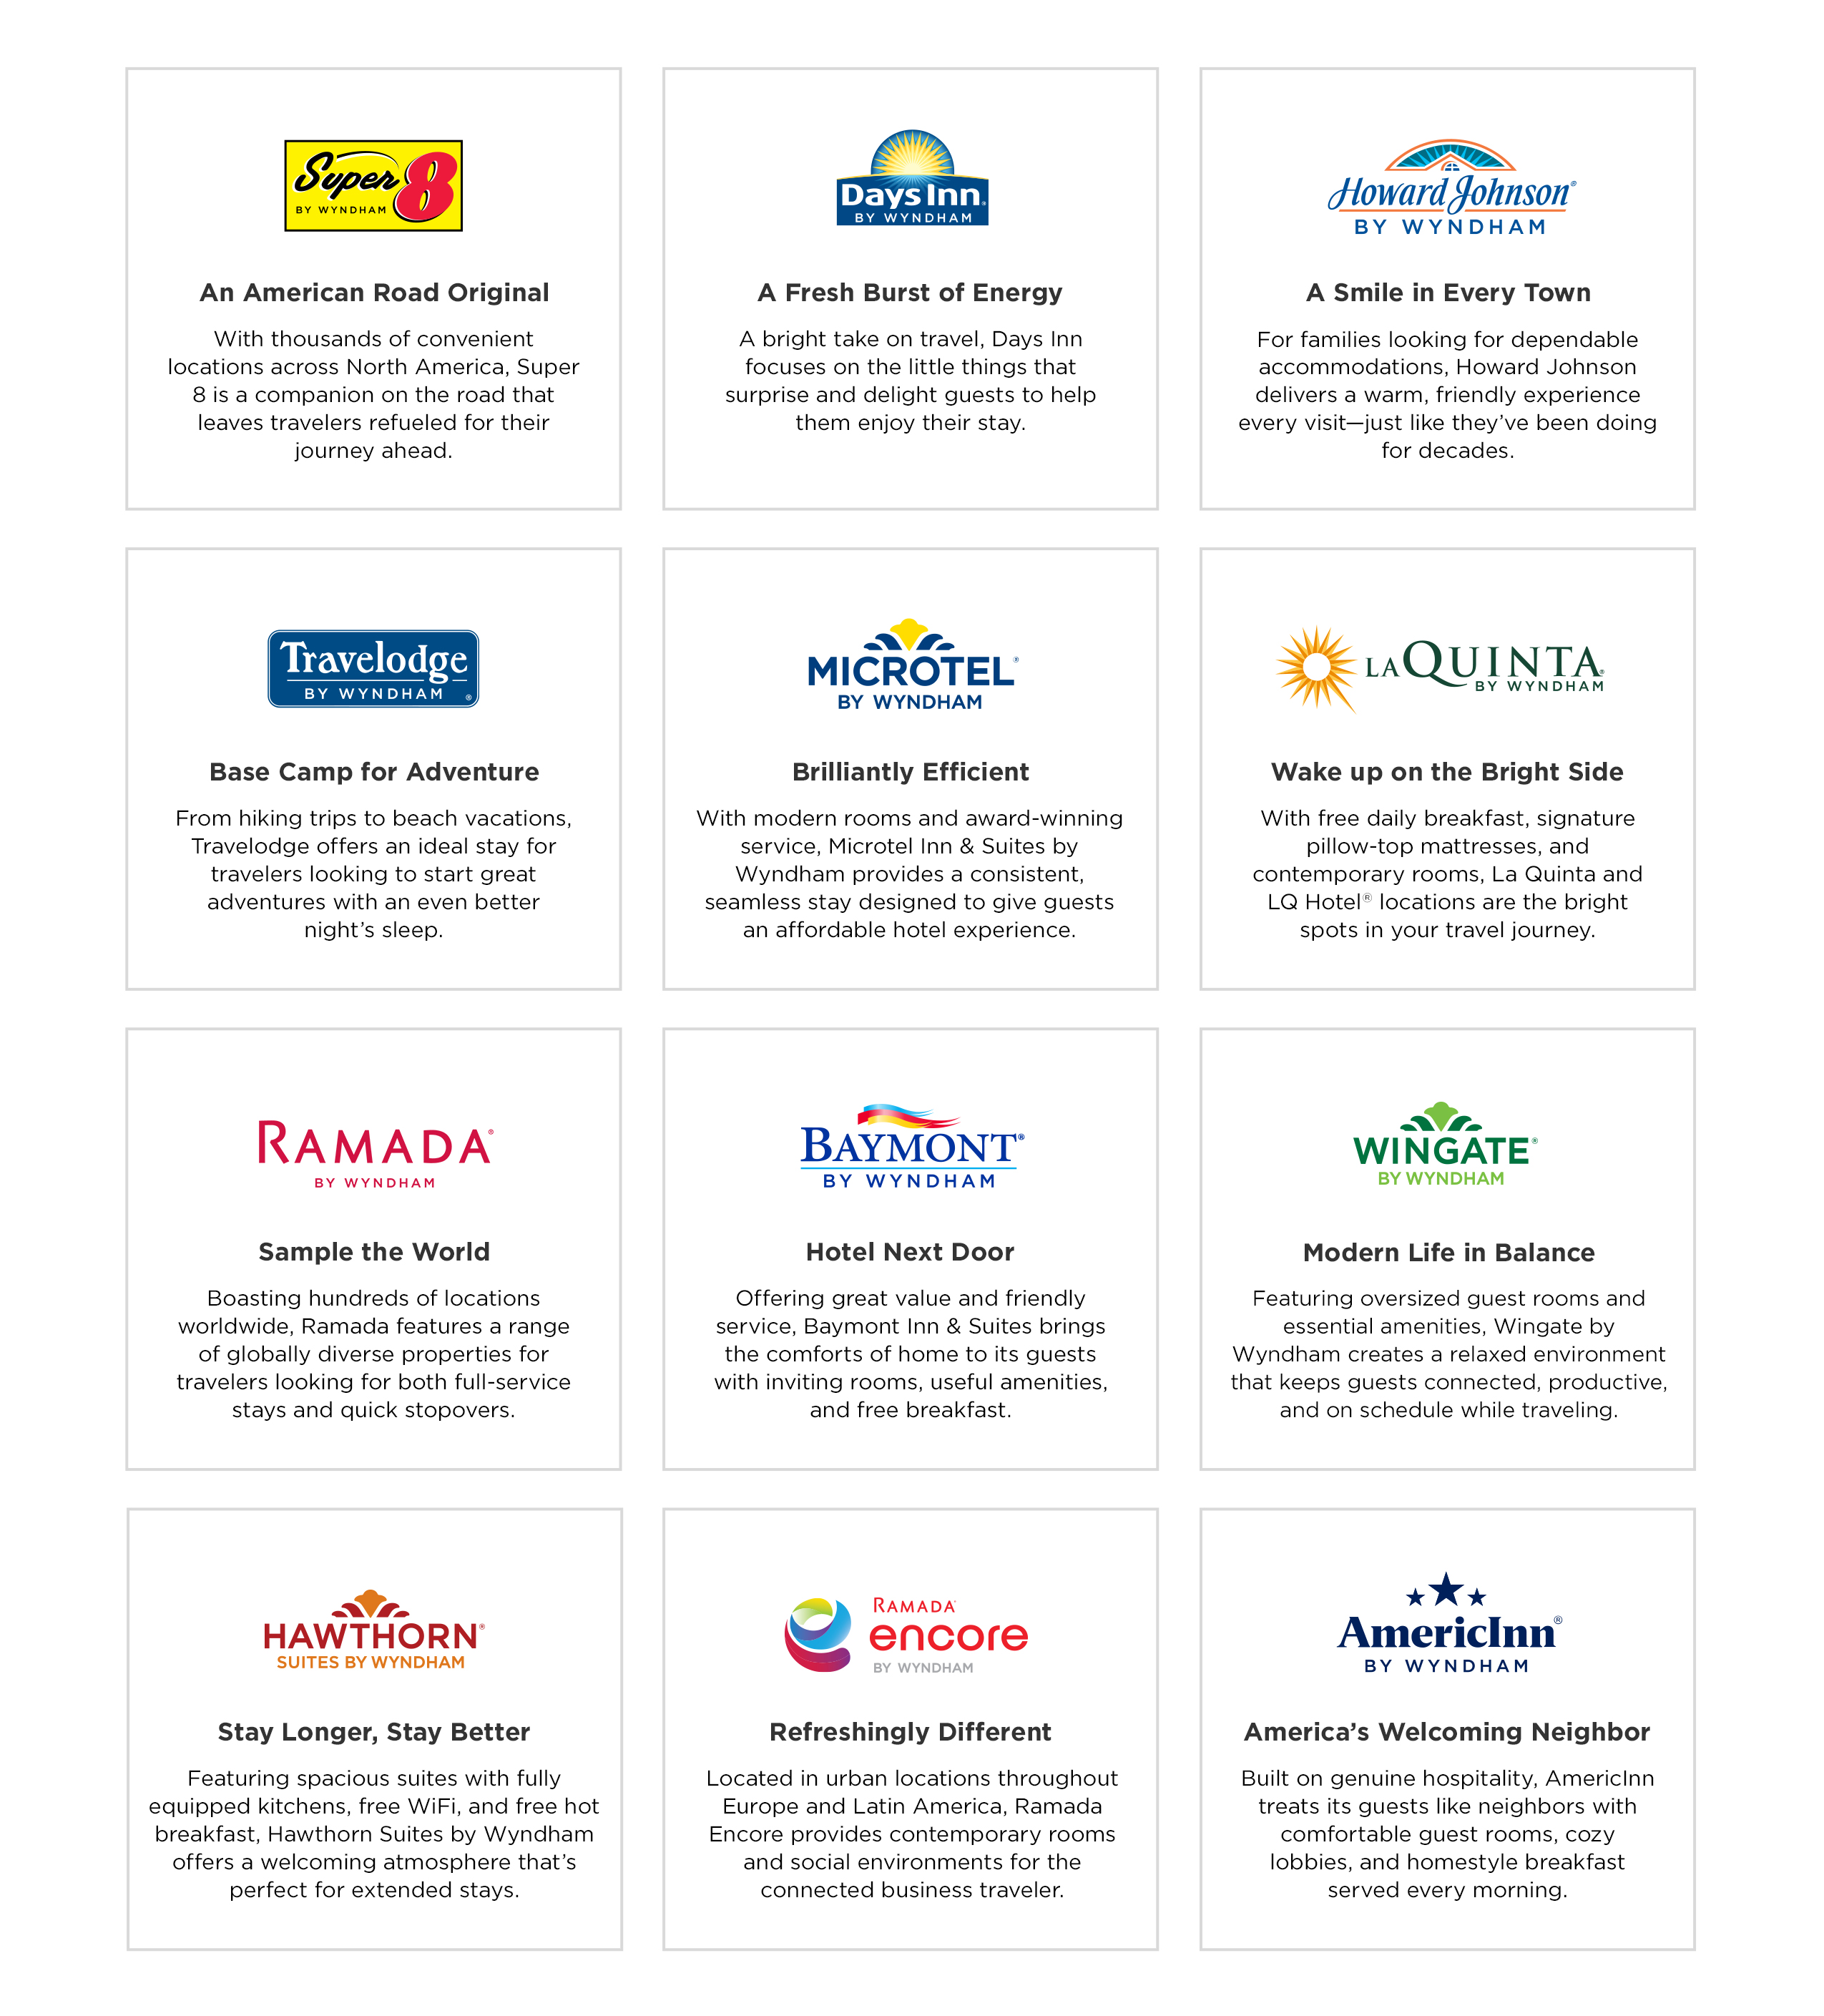
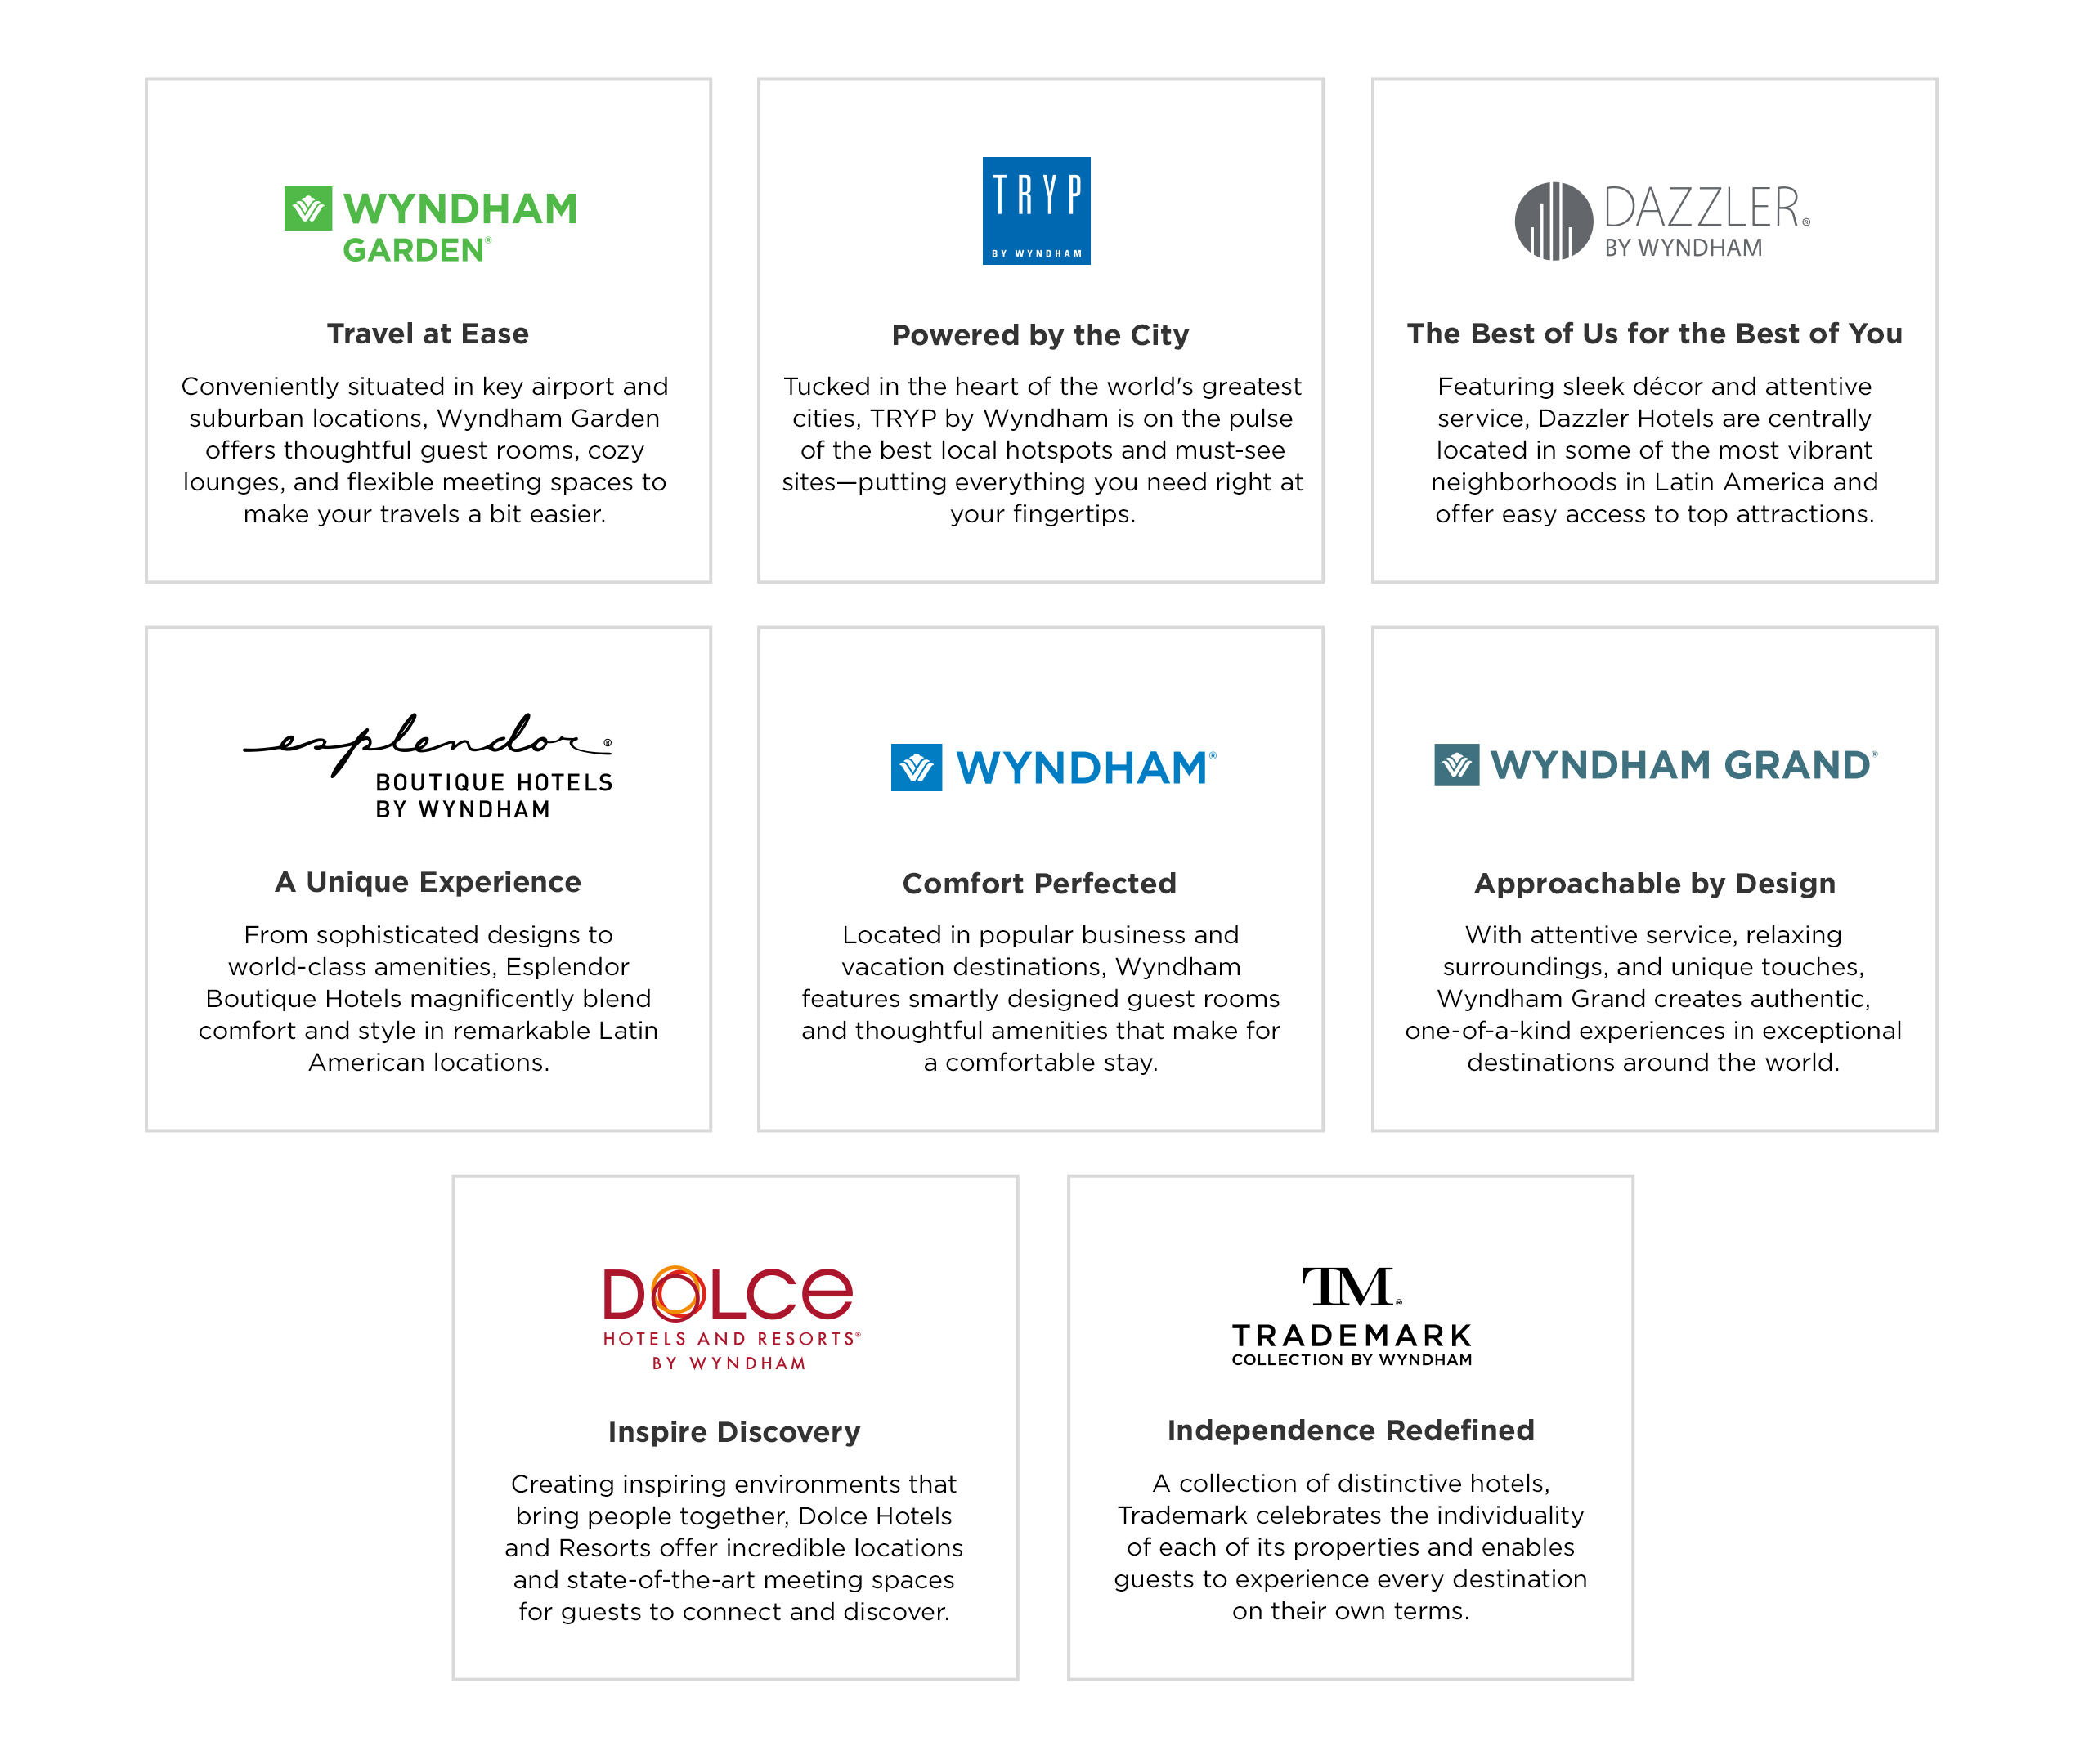
Strong portfolio of well-known brands
We have assembled a portfolio of 20 well-known hotel brands, from leading economy and midscale brands such as Super 8, Days Inn and La Quinta to upscale brands such as Wyndham and Dolce. Our Super 8 brand, with over 2,800 affiliated hotels, has more hotel properties than any other hotel brand in the world. Our brands are located in primary, secondary and tertiary cities and are among the most recognized in the industry. Over 80% of the U.S. population lives within ten miles of one or more of our affiliated hotels. Furthermore, with the addition of the “by Wyndham” endorser, our brands now enjoy even higher awareness.
Our brands offer a breadth of options for franchisees and a wide range of price points and experiences for our guests, including members of our award-winning Wyndham Rewards loyalty program. Our brands have also won numerous industry awards, both for guest satisfaction and as franchise opportunities for entrepreneurs. With many of our affiliated hotels located along major highways, our brands not only drive online and telephone reservations to hotels, they also help attract guests on a “walk-in” or direct-to-hotel basis.
Global leader in the economy and midscale segments
We have built a leading position in the economy and midscale segments of the hotel industry, with our brands representing approximately 40% of both U.S. economy and U.S. midscale hotel inventory. Our central reservation channels generate nearly half of our franchisees’ occupied room-nights annually and over 60% of guests at our franchised hotels in the United States. In addition, we have substantial experience in property design, hotel management training, establishing brand standards, advertising, structuring promotional offerings and online marketing for economy and midscale brands. Our economy and midscale brands are consistently highly ranked in J.D. Power’s North American Hotel Guest Satisfaction Index Study for those segments.
Our strength in the economy and midscale segments is attractive to potential franchisees and positions us well to benefit from favorable demographic and consumer demand trends. According to the Brookings Institution, just over 50 percent of the world’s population, or some 3.8 billion people, is considered part of the global middle class. As this population increasingly participates in the global travel and leisure industry, we expect the economy and midscale segments will be a natural entry point.
Award-winning loyalty program
Wyndham Rewards, our award-winning loyalty program, is a key component of our ongoing efforts to build consumer and franchisee engagement while driving more guest reservations directly to our affiliated hotels. Approximately 61 million people have enrolled in Wyndham Rewards since its inception, and substantially all 9,157 hotels affiliated with our hotel brands participate in the program. In addition, over 25,000 vacation ownership and rental properties participate in the program. Wyndham Rewards generates significant repeat business by rewarding frequent stays with points. Since being redesigned in 2015, Wyndham Rewards has been recognized as one of the simplest, most rewarding loyalty programs in the hotel industry, providing more value to members than any other program. It has won more than 60 awards, including “Best Hotel Loyalty Program” from US News & World Report, “Best Hotel Loyalty Program” in USA TODAY, “10 Best Readers’ Choice Awards”, “Most Rewarding Hotel Loyalty Program” from IdeaWorks and the #1 ranking on WalletHub’s list of “Best Hotel Rewards Programs” in 2018 for the fourth consecutive year.
Wyndham Rewards loyalty program members now account for approximately one-third of occupancy at our affiliated hotels. Total membership has been growing by over 10% annually for the past six years. Our franchisees benefit from the program through increased guest loyalty and the more than one million room-nights for which award points were redeemed for each of the past two years. These members are an important driver of our growth, as they spend nearly twice as much as non-members, on average.
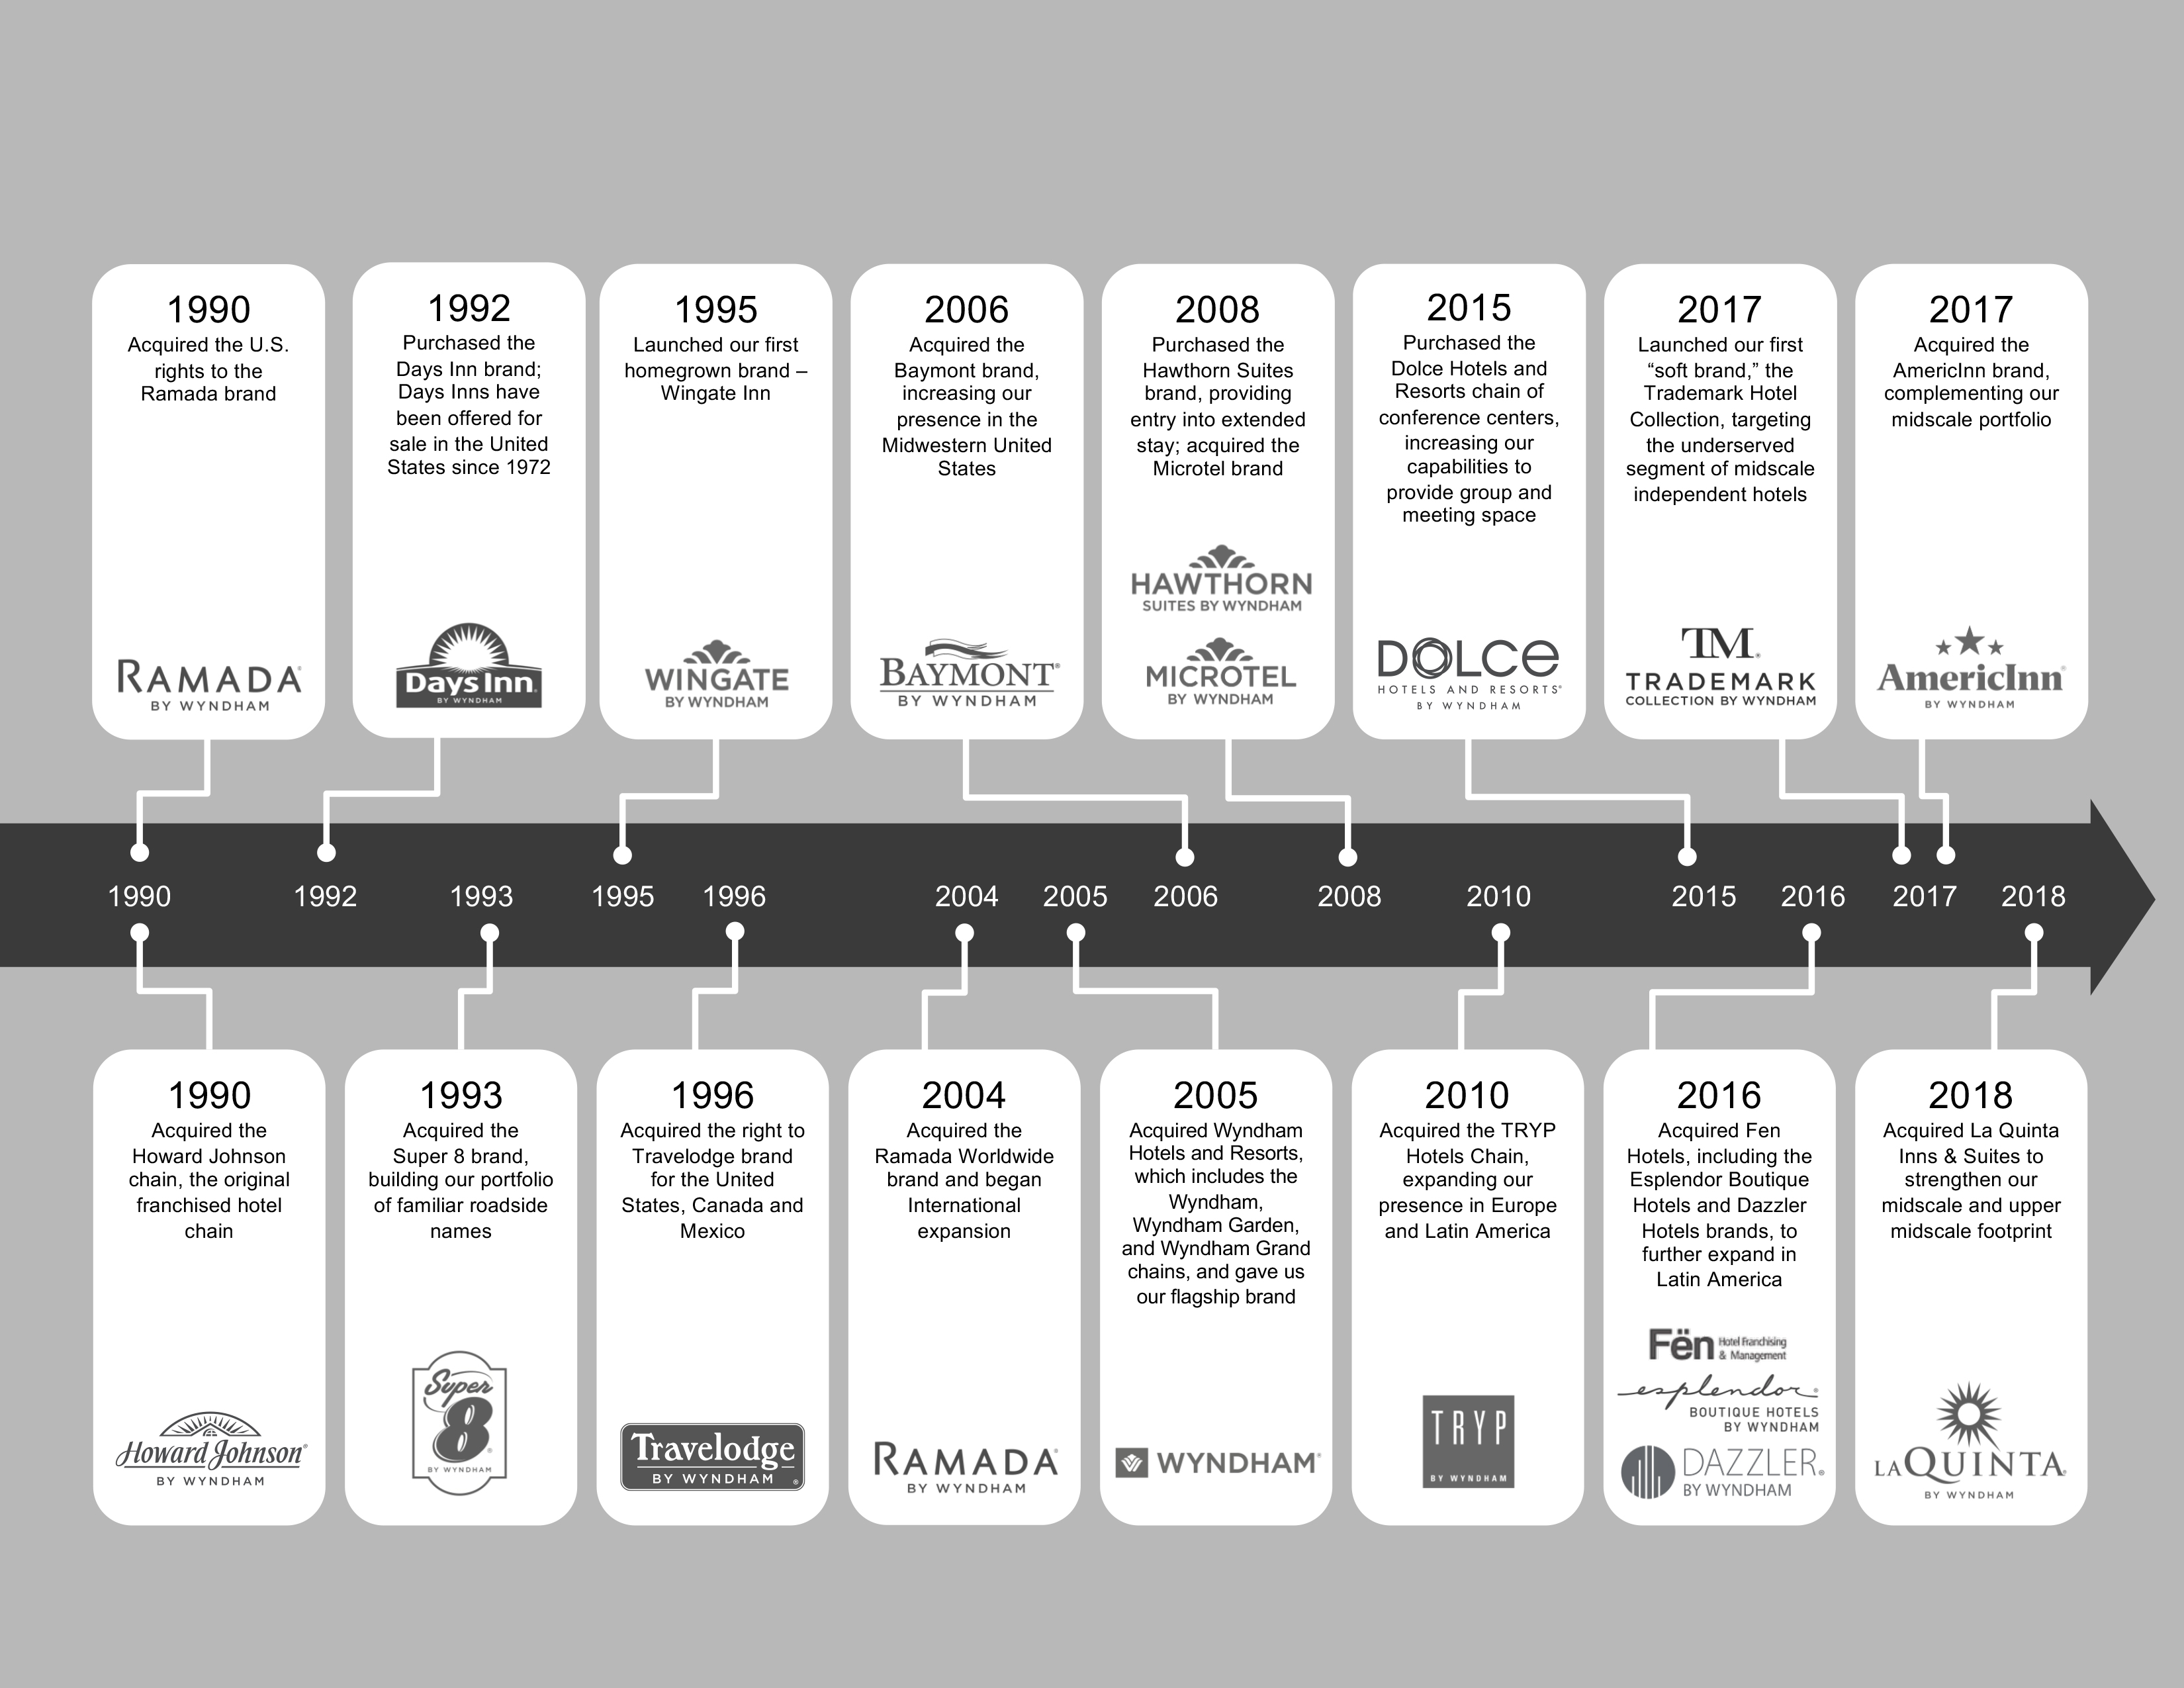
Proven ability to create value through acquisitions
We have built our portfolio of renowned hotel brands primarily through acquisitions, beginning with the Howard Johnson brand and the U.S. franchise rights for the Ramada brand in 1990. Since then, we have acquired 16 economy, midscale, upscale and extended-stay brands, enabling us to meet travelers’ leisure and business travel needs across a wide range of price points, experiences and geographies. We have established an extensive track record of successfully integrating franchise systems and enhancing the performance of brands post-acquisition by leveraging our operating best practices, significant economies of scale, award-winning Wyndham Rewards loyalty program and access to global distribution networks, while producing significant cost synergies for us and our franchisees. We intend to build upon our past success as we continue to opportunistically acquire and integrate brands into our franchising platform.
In addition, we have grown many of the franchise systems we have acquired to be significantly larger than at acquisition. For example, after acquiring the economy-focused Baymont Inn portfolio in 2006, we re-positioned the brand within the midscale segment as Baymont Inn & Suites by Wyndham and have more than tripled its size from 115 hotels to 513 hotels in North and Latin America. Similarly, we have doubled the size of our flagship Wyndham brand since we acquired it in 2005. We believe these capabilities, combined with our scale, enable us to be highly competitive for acquisition opportunities.
Strong and experienced management team
Our executive management team is focused on building upon Wyndham Hotels’ past success and track record of growth through its deep industry experience and leadership continuity. We benefit significantly from the experience of our executive officers, who have an average of 19 years of experience in the travel and hospitality industries. Our chief executive officer, Geoffrey Ballotti, spent 20 years with Starwood Hotels & Resorts before joining Wyndham Worldwide in 2008 and has been instrumental in transforming our business over the past several years through acquisitions and technology-related initiatives.
Our non-executive chairman, Stephen Holmes, has 28 years of experience in the hospitality industry and served as Wyndham Worldwide’s chief executive officer from 2006 to 2018. Our chief financial officer, David Wyshner, has 19 years of experience in the travel industry and previously served as president and chief financial officer of Avis Budget Group. As a group, our executive officers have extensive experience with leading global hospitality and consumer-brand companies.
Our Strategy
Our objective is to be the world’s leading provider of select-service hotel brands by delivering the best value to owners and guests. We expect to achieve our goals by focusing on the following core strategic initiatives:
Attract, retain and develop franchisees
We intend to attract and retain franchisees and grow our system size by maintaining and increasing the value we provide to franchisees. With more than 5,900 franchisees, we have built the largest network of franchisees of any global hotel company. These hotel owners and developers provide the engine and platform for future growth. In order to attract, retain and serve franchisees, we plan to:
| |
• | continually enhance the competitive position and awareness of our brands; |
| |
• | provide cost-effective new-construction and renovation prototypes to enhance owners’ returns; |
| |
• | offer best-in-class, cost-effective technology solutions; and |
| |
• | drive reservations to our franchisees through our proprietary booking and third-party distribution channels. |
We are focused on building brand awareness, brand preference and reservations by presenting the value propositions of each of our hotel brands in all relevant channels to consumers who are likely to have the greatest propensity to stay with us. We provide value-engineered hotel designs and prototypes to property owners and developers to help them boost the returns they generate from their investments. We also provide our franchisees with fully integrated, turn-key property management, reservations and revenue management systems that have capabilities that were not previously affordable to hotels in the economy and midscale sectors.
We continuously innovate in our e-commerce channels, including websites and mobile applications for our brands, to enhance the consumer experience and drive reservations to our franchisees. We also operate telephone reservation and customer service centers around the world, and provide easy access to third-party distribution channels for our franchisees. Finally, we develop strong, consultative relationships with our franchisees, beginning with the sales process, where we work with hotel owners to determine how our brands will optimize their investment. We nurture this relationship throughout the life of the contract, continually assessing our franchisees’ needs, providing solutions to meet those needs and partnering with them to grow their business. These efforts help us to retain approximately 94% of our total properties each year and to welcome an average of approximately two new hotels into our system every day.
Elevate the economy and midscale guest experience
We believe every type of traveler should have a great travel experience, regardless of price point. We are building on our leading positions in the economy and midscale hotel segments to reshape and elevate the economy and midscale hotel experience. This process starts with our iconic economy brands – Days Inn, Super 8, Howard Johnson and Travelodge – which we have redefined through new brand standards to offer a meaningfully enhanced guest experience. These changes enable our franchisees to create an upscale guest experience at an economy price point.
Our brands are among the most respected in the industry and have won numerous awards for the quality and consistency of service they provide. We intend to continue to drive favorable consumer perception of our brands through our brand standards, hotel management training, quality assurance, marketing and franchisee relations. As a result, we believe our reshaped and elevated economy and midscale brands will be a natural entry point for millennials and other price-conscious travelers, who are looking for quality branded experiences at an affordable price point.
Grow our footprint in new and existing international markets
With a diverse, global network of brands already represented in more than 80 countries, we intend to expand in new and existing international markets. Over the past five years, our international portfolio has grown at a compound annual rate of 9%, to nearly 2,800 hotels, and now represents approximately 30% of the hotels in our system.
We have built a strong, flexible international franchise sales platform, with more than 100 sales professionals in key locations around the world, including in Europe, Latin America, India, China, Singapore and the Middle East. We typically focus on rapidly developing countries that are under-served by the hotel industry. We also look for flagship opportunities in higher-traffic markets throughout the world to aid international brand awareness and loyalty. We believe our flexibility as a sales organization and our diverse portfolio of brands enable us to effectively adapt our sales strategies in response to franchisees’ and hotel developers’ needs, and to changes in global supply and demand.
Currently, our pipeline of executed franchise contracts and applications consists of over 1,400 hotels with nearly 180,000 rooms, of which more than half are international. As we grow internationally, we are particularly focused on brand quality and property design, with approximately 90% of our existing international pipeline being new-construction projects.
Use cash flow to create value for stockholders
We intend to use the cash flow generated by our operations to create value for stockholders. Our asset-light business model, with low fixed costs and stable, recurring franchise fee revenue, generates attractive margins and cash flow. In addition to investments in the business, including acquisitions of brands and businesses that would expand our presence and capabilities in the lodging industry, we expect to return capital to our stockholders through dividends and/or share repurchases. We expect to pay a regular dividend and use excess cash to repurchase shares.
Recent Developments
Our Spin-off
On May 31, 2018, Wyndham Hotels became an independent, public company when it was spun-off from Wyndham Worldwide Corporation, its former parent, which is now known as Wyndham Destinations. Wyndham Hotels’ common stock trades on the New York Stock Exchange under the ticker “WH”.
In conjunction with the spin-off, we entered into agreements with Wyndham Destinations governing the terms of our separation, providing for certain transition services to be provided by each company to the other, and granting a 100-year license to Wyndham Destinations for the use of the “Wyndham” trademark in exchange for license fees payable to Wyndham Hotels. Wyndham Destinations is the world’s largest vacation ownership and exchange company with 220 vacation ownership resorts and over 4,300 affiliated exchange properties. (See “Relationship with Wyndham Destinations.”)
The La Quinta Acquisition
On May 30, 2018, we completed the previously announced acquisition of La Quinta Holdings Inc.’s hotel franchising and hotel management business (“La Quinta”) for $1.95 billion in cash.
In addition to adding over 900 hotels to the world’s largest hotel network, the acquisition of La Quinta strengthened our position in the midscale and upper midscale segments of the hotel industry, which has been and continues to be one of our strategic priorities. Following the La Quinta acquisition, Wyndham Hotels franchises the largest number of midscale and economy hotels in the industry. In addition, for the first time in La Quinta's history, Smith Travel Research (“STR”) has moved the brand to their upper midscale from midscale segment of the industry. We expect to leverage our sales and development capabilities to further grow the La Quinta brand in the United States and across Latin America. The acquisition has expanded our managed hotel network by almost 280%, from 116 hotels just prior to the acquisition to 440 properties, making us the sixth-largest hotel manager in the United States. Hotel management represents an attractive expansion opportunity to grow our asset-light business and further penetrate the midscale and higher segments.
The La Quinta Returns loyalty program, with over 8 million enrolled members, will be combined with the award-winning Wyndham Rewards loyalty program, with approximately 61 million enrolled members, in 2019.
We expect to generate substantial synergies when integrating La Quinta into our existing business by eliminating redundant public company expenses and reducing operating costs associated with technology, distribution and marketing as we leverage our scale and existing infrastructure. We anticipate that additional revenue benefits will come from incremental domestic and international expansion as well as RevPAR growth from a broader distribution platform.
Adding “By Wyndham” to Brands
In April 2018, Wyndham Hotels announced that it would be adding the “by Wyndham” hallmark to twelve of its brands: Super 8, Days Inn, Howard Johnson, Travelodge, AmericInn, Baymont, Ramada, Ramada Encore, Dolce, Dazzler, Esplendor and Trademark. Updated brand names and logos began appearing in April 2018. Additionally, in October 2018, we announced that we would be adding the “by Wyndham” hallmark to the La Quinta brand. We believe that the addition of “by Wyndham” cross-branding is boosting our, and our franchisees’, RevPAR performance and overall strength of our brands.
THE HOTEL INDUSTRY
Companies in the hotel industry typically operate through a combination of one or more of the following business models.
Franchise – Under the franchise model, a company typically grants the use of a brand name to a hotel owner in exchange for royalty fees, which are typically a percentage of gross room revenues, and provides marketing and reservation services for a fee, which is calculated similarly. Since the royalty fees are a recurring revenue stream and the related cost structure is relatively low, the franchise model often yields attractive margins and steady, predictable cash flows. Franchisors generally do not directly participate in the daily management or operation of franchised hotels.
Management – Under the management model, a company provides professional oversight and comprehensive operations support to hotel owners in exchange for base management fees, which are typically a percentage of total hotel revenue. A company can also earn incentive management fees which are tied to the financial performance of the hotel. In addition to management and incentive fees, typical management agreements include a provision that hotel owners will pay ongoing marketing and reservation fees, which are based on a percentage of gross room sales.
Ownership – Under the ownership model, a company owns a hotel and bears all financial risks and rewards relating to the hotel, including appreciation and depreciation in the value of the property. Ownership requires a substantial capital commitment and typically has a high fixed-cost structure.
The hotel industry, and hotel ownership in particular, is cyclical in nature. Companies operating under the franchise model are largely insulated from this risk when compared with the other two business models since they do not own the hotels and have limited operating costs. Therefore, a company’s strategic positioning and presence within these business models can influence overall profitability, particularly in a volatile economy.
According to STR, as of December 31, 2018, the global hotel market consisted of approximately 191,000 hotels with combined annual revenues of $540 billion. This represents over 17.6 million rooms, of which 54% are affiliated with a brand. The industry is geographically concentrated with the top 20 countries accounting for over 80% of total rooms. The United States has the largest presence in the global hotel industry with 5.2 million rooms, representing approximately 30% of the global market. China is the next largest concentration with 2.5 million rooms, representing approximately 14% of the global market. The geographical distribution as of December 31, 2018 was as follows:
|
| | | | | | | | | | | | | |
Region | | Hotels | | Room Supply (millions) | | Revenues (billions) | | Brand Affiliation |
United States/Canada | | 61,602 |
| | 5.7 |
| | $ | 177 |
| | 70 | % |
Europe | | 69,870 |
| | 4.8 |
| | 168 |
| | 40 | % |
Asia Pacific | | 40,090 |
| | 5.0 |
| | 130 |
| | 54 | % |
Latin America/Middle East | | 19,470 |
| | 2.1 |
| | 65 |
| | 43 | % |
Performance in the U.S. lodging industry is evaluated based upon chain scale segments, which are generally defined as follows:
|
| | | | |
Chain Scale | | % of U.S. Market | | Typical Amenities |
Economy | | 12% | | Basic amenities |
Midscale | | 9% | | Limited breakfast, selected business services |
Upper Midscale | | 11% | | Restaurants, vending, selected business services and some recreational facilities |
Upscale | | 16% | | Full range of on-property amenities and services, including restaurants, recreational facilities and business centers |
Upper Upscale | | 13% | | Full range of on-property amenities and services |
Luxury | | 11% | | Luxury accommodations and extensive range of on-property amenities and services |
Brand Affiliated | | 72% | | |
| | | | |
Independents | | 28% | | |
| | | | |
Total | | 100% | | |
History
Our business was initially incorporated as Hospitality Franchise Systems, Inc. in 1990 to acquire the Howard Johnson brand and the franchise rights to the Ramada brand in the United States. It was an integral part of Wyndham Worldwide Corporation and its predecessor from 1997 to 2018. Wyndham Hotels became an independent, public company in May 2018, when it was spun-off from Wyndham Worldwide. Our business has grown substantially over time through acquisitions and organic expansion.
Our System
With nearly 9,200 affiliated hotels in our brand portfolio, our global footprint is substantially greater than that of any other hotel company in the world. Our brands can be found in over 80 countries, with the heaviest geographic concentration in the United States and Greater China:
|
| | | | | | | | |
| | # of Properties | | % of System |
United States | | | 6,358 |
| | | 70 | % |
Asia Pacific | | | 1,615 |
| | | 18 | % |
Canada | | | 490 |
| | | 5 | % |
Europe/Middle East/Africa | | | 479 |
| | | 5 | % |
Latin America | | | 215 |
| | | 2 | % |
Global | | | 9,157 |
| | | 100 | % |
We welcome over 150 million guests annually worldwide. While our portfolio spans a wide array of hotel brand offerings, we are the leader in the economy and midscale segments of the hotel industry.
|
| | | | | | | | |
| | # of Properties | | % of System |
Economy | | | 5,733 |
| | | 62 | % |
Midscale | | | 2,814 |
| | | 31 | % |
Lifestyle | | | 255 |
| | | 3 | % |
Upscale | | | 245 |
| | | 3 | % |
Extended Stay | | | 110 |
| | | 1 | % |
| | | 9,157 |
| | | 100 | % |
Our portfolio of brands appeals to a broad range of consumers. With diverse offerings across chain scales, geographies and price points, and a particular focus on economy and midscale hotels, we seek to address the travel needs of the over three billion people in the expanding global middle class. Our brands combine innovative design, quality and affordability that attracts today’s value-conscious consumer. While our typical guest is a leisure traveler, our industry-leading scale and presence in major, secondary and tertiary cities also attract business travelers. Many hotels affiliated with our brands are located on interstate and highway roadsides, catering to value-oriented guests seeking quality accommodations in convenient locations. We also seek to appeal to the growing millennial generation through our investment in consumer-facing technology, online and social media marketing, innovative new-construction prototypes and redesigned rooms and lobbies.
The following table presents the changes in our portfolio for the last three years:
|
| | | | | | | | | | | | | | | | | |
| As of December 31, |
| 2018 | | 2017 | | 2016 |
| Properties | | Rooms | | Properties | | Rooms | | Properties | | Rooms |
Beginning balance | 8,422 |
| | 728,200 |
| | 8,035 |
| | 697,600 |
| | 7,812 |
| | 678,000 |
|
Additions | 1,512 |
| | 145,800 |
| | 811 |
| | 72,200 |
| | 627 |
| | 58,700 |
|
Deletions | (777) | | (64,100) | | (424) | | (41,600) | | (404) | | (39,100) |
Ending balance | 9,157 |
| | 809,900 |
| | 8,422 |
| | 728,200 |
| | 8,035 |
| | 697,600 |
|
In addition to our existing franchisees, we have a development pipeline of over 1,400 hotels, representing nearly 180,000 rooms as of December 31, 2018. Typically, about 80% of executions open within the following 24 months. While there can be no assurance that any particular property in our pipeline will eventually become franchised by us, our pipeline is typically only a subset of our development activity in any given period. Approximately half of our annual hotel additions are executed and opened in less than 90 days and therefore may never appear in our pipeline.
Our Brands
Through our diverse portfolio of well-recognized hotel brands, we offer consumers hotel options in markets throughout the world with a wide range of amenities and at a variety of price points.
As of December 31, 2018, our brand portfolio consisted of the following:
|
| | | | | | | | | | | | | | | | | | | | | | | | | |
| | | | | North America | | Asia Pacific | | Europe, | | | | |
| Global RevPAR | | | | U.S. | | Canada | | Greater China | | Rest of Asia | | Middle East and Africa | | Latin America | | Total |
Economy | | | | | | | | | | | | | | | | | |
Super 8 | $ | 28.01 |
| | Properties | | 1,590 |
| | 126 |
| | 1,168 |
| | — |
| | 4 |
| | 1 |
| | 2,889 |
| | | Rooms | | 95,955 |
| | 8,050 |
| | 73,355 |
| | — |
| | 618 |
| | 50 |
| | 178,028 |
Days Inn | $ | 36.21 |
| | Properties | | 1,456 |
| | 113 |
| | 75 |
| | 15 |
| | 63 |
| | 6 |
| | 1,728 |
| | | Rooms | | 109,366 |
| | 8,908 |
| | 12,766 |
| | 2,218 |
| | 3,984 |
| | 436 |
| | 137,678 |
Travelodge | $ | 38.98 |
| | Properties | | 337 |
| | 98 |
| | — |
| | — |
| | — |
| | — |
| | 435 |
| | | Rooms | | 22,413 |
| | 8,592 |
| | — |
| | — |
| | — |
| | — |
| | 31,005 |
Microtel | $ | 43.00 |
| | Properties | | 306 |
| | 17 |
| | — |
| | 14 |
| | — |
| | 6 |
| | 343 |
| | | Rooms | | 21,713 |
| | 1,482 |
| | — |
| | 1,037 |
| | — |
| | 715 |
| | 24,947 |
Howard Johnson | $ | 31.58 |
| | Properties | | 188 |
| | 28 |
| | 65 |
| | 3 |
| | 5 |
| | 49 |
| | 338 |
| | | Rooms | | 15,112 |
| | 1,887 |
| | 20,577 |
| | 1,107 |
| | 500 |
| | 2,998 |
| | 42,181 |
Midscale | | | | | | | | | | | | | | | | | |
La Quinta | $ | 64.05 |
| | Properties | | 898 |
| | 2 |
| | — |
| | — |
| | — |
| | 14 |
| | 914 |
| | | Rooms | | 87,386 |
| | 133 |
| | — |
| | — |
| | — |
| | 1,937 |
| | 89,456 |
Ramada | $ | 39.65 |
| | Properties | | 335 |
| | 81 |
| | 96 |
| | 70 |
| | 203 |
| | 26 |
| | 811 |
| | | Rooms | | 40,149 |
| | 7,834 |
| | 21,318 |
| | 12,530 |
| | 29,409 |
| | 3,374 |
| | 114,614 |
Baymont | $ | 39.64 |
| | Properties | | 509 |
| | 3 |
| | — |
| | — |
| | — |
| | 1 |
| | 513 |
| | | Rooms | | 40,073 |
| | 350 |
| | — |
| | — |
| | — |
| | 118 |
| | 40,541 |
AmericInn | $ | 51.62 |
| | Properties | | 204 |
| | — |
| | — |
| | — |
| | — |
| | — |
| | 204 |
| | | Rooms | | 12,072 |
| | — |
| | — |
| | — |
| | — |
| | — |
| | 12,072 |
Wingate | $ | 55.28 |
| | Properties | | 154 |
| | 8 |
| | 1 |
| | — |
| | — |
| | 1 |
| | 164 |
| | | Rooms | | 13,707 |
| | 787 |
| | 188 |
| | — |
| | — |
| | 176 |
| | 14,858 |
Wyndham Garden | $ | 50.92 |
| | Properties | | 71 |
| | 3 |
| | 2 |
| | 3 |
| | 17 |
| | 23 |
| | 119 |
| | | Rooms | | 11,690 |
| | 479 |
| | 403 |
| | 374 |
| | 2,765 |
| | 3,122 |
| | 18,833 |
Ramada Encore | $ | 29.26 |
| | Properties | | — |
| | — |
| | 18 |
| | 12 |
| | 20 |
| | 10 |
| | 60 |
| | | Rooms | | — |
| | — |
| | 3,287 |
| | 3,071 |
| | 2,458 |
| | 1,355 |
| | 10,171 |
Extended Stay | | | | | | | | | | | | | | | | | |
Hawthorn | $ | 55.18 |
| | Properties | | 103 |
| | — |
| | — |
| | — |
| | 7 |
| | — |
| | 110 |
| | | | | 9,929 |
| | — |
| | — |
| | — |
| | 704 |
| | — |
| | 10,633 |
Lifestyle | | | | | | | | | | | | | | | | | |
Trademark | $ | 70.28 |
| | Properties | | 27 |
| | 5 |
| | — |
| | — |
| | 52 |
| | — |
| | 84 |
| | | Rooms | | 4,949 |
| | 497 |
| | — |
| | — |
| | 8,620 |
| | — |
| | 14,066 |
TRYP | $ | 56.38 |
| | Properties | | 9 |
| | — |
| | 1 |
| | 3 |
| | 78 |
| | 19 |
| | 110 |
| | | Rooms | | 1,062 |
| | — |
| | 95 |
| | 316 |
| | 11,099 |
| | 2,947 |
| | 15,519 |
Dazzler | $ | 60.77 |
| | Properties | | — |
| | — |
| | — |
| | — |
| | — |
| | 12 |
| | 12 |
| | | Rooms | | — |
| | — |
| | — |
| | — |
| | — |
| | 1,551 |
| | 1,551 |
Esplendor | $ | 50.58 |
| | Properties | | — |
| | — |
| | — |
| | — |
| | — |
| | 10 |
| | 10 |
| | | Rooms | | — |
| | — |
| | — |
| | — |
| | — |
| | 958 |
| | 958 |
Upscale | | | | | | | | | | | | | | | | | |
Wyndham | $ | 62.51 |
| | Properties | | 40 |
| | — |
| | 28 |
| | 13 |
| | 15 |
| | 36 |
| | 132 |
| | | Rooms | | 11,455 |
| | — |
| | 8,479 |
| | 2,180 |
| | 3,095 |
| | 8,394 |
| | 33,603 |
Wyndham Grand | $ | 72.51 |
| | Properties | | 12 |
| | — |
| | 16 |
| | 1 |
| | 8 |
| | — |
| | 37 |
| | | Rooms | | 3,389 |
| | — |
| | 5,713 |
| | 194 |
| | 2,057 |
| | — |
| | 11,353 |
Dolce | $ | 86.71 |
| | Properties | | 10 |
| | 3 |
| | — |
| | — |
| | 7 |
| | — |
| | 20 |
| | | Rooms | | 2,202 |
| | 276 |
| | — |
| | — |
| | 1,546 |
| | — |
| | 4,024 |
Total (a) | $ | 40.80 |
| | Properties | | 6,358 |
| | 490 |
| | 1,470 |
| | 145 |
| | 479 |
| | 215 |
| | 9,157 |
| | | Rooms | | 506,068 |
| | 39,590 |
| | 146,181 |
| | 23,074 |
| | 66,855 |
| | 28,165 |
| | 809,933 |
______________________
| |
(a) | Total includes 3,446 rooms (109 properties) in the United States, 315 rooms (3 properties) in Canada, 47 rooms (11 properties) in Rest of Asia and 34 rooms (1 property) in the Latin America under affiliation arrangements with Wyndham Destinations. |
Wyndham Rewards
Wyndham Rewards is our award-winning guest loyalty program that supports our brand portfolio and entire system of affiliated hotels. The program generates substantial repeat business for our franchisees by rewarding frequent stays with points that can be redeemed for free nights or other rewards, such as airline tickets and gift cards. Based on the principles of being a generous and simple program, loyalty members earn a minimum number of points for every qualified stay and are able to redeem a free night at any of our affiliated hotels for a fixed number of points. In addition to the 9,157 hotels in our system, Wyndham Rewards members are able to redeem points in over 20,000 vacation ownership and rentals properties pursuant to agreements with Wyndham Destinations and affiliates of Wyndham Vacation Rentals Europe.
Since inception, approximately 61 million people have enrolled in Wyndham Rewards. Wyndham Rewards members generated over 30% of our franchisees’ room-nights in 2018.
We license the Wyndham Rewards name to Visa in a co-branded credit card arrangement. Wyndham Rewards members who have the Wyndham Rewards Visa credit card benefit by earning points for purchases that can be used to redeem stays at any of our affiliated hotels, as well as certain other rewards. We generate revenue primarily by cardholder spending activity and the enrollment of new cardholders. Our Wyndham Rewards Visa credit card program has been growing rapidly, with cardholder spend activity up approximately 84% from 2014.
Our Hotel Franchising Business
We primarily license our brand names and associated trademarks to hotel owners under long-term franchise agreements. Our franchise agreements are typically 10 to 20 years in length and generally include a royalty fee of approximately 4% to 5% of gross room revenue and a marketing and reservation fee of approximately 3% to 5% of gross room revenue. Once a franchise agreement is executed, we will receive this cash flow stream throughout the term of the agreement. Our franchise business is adaptable to changing economic environments due to low operating cost structures and our ability to add affiliated hotels with little to no upfront capital investment by us. This, in addition to the recurring fee streams provided by royalty fees, results in a resilient business model that yields attractive margins and predictable cash flows and enables us to successfully manage industry fluctuations.
Early in our international development efforts, we entered new markets through master franchise agreements, whereby we licensed our hotel brands and our associated trademarks to third parties that assumed the principal role of franchisor. Since we provide limited services to master franchisors, the fees we receive in connection with these agreements are typically lower than the fees we receive under a direct franchising model. As our international presence expanded, our need to enter into master franchise agreements decreased, enabling us to transition to a more traditional direct franchise relationship.
Our franchise sales team consists of over 100 sales professionals serving customers throughout the world. Our sales team is focused on growing our franchise business through conversions of existing branded and independent hotels and partnering with developers to brand newly constructed hotels. Our franchise sales teams are generally responsible for selling all brands within a specified region and promoting the specific brand that is best suited for the specific property and location. In addition to a regional presence in the United States, we currently have development teams located in London, Istanbul, Dubai, Shanghai, Singapore, Canada, Delhi, Sao Paulo and Buenos Aires. Our international presence in key countries allows us to quickly adapt to changes in the increasingly dynamic global marketplace and to capitalize on new opportunities throughout the world as they emerge. We occasionally provide financial support in the form of loans or development advances to help generate new business. In 2018, of the more than 1,000 new and renewal franchise agreements we executed, only 6% received financial support from us, totaling $27 million.
Our typical franchisee is a first-time hotelier and single property owner. Frequently, the hotel is our franchisee’s primary source of income. We offer these small business owners a variety of services, including (i) education and training on best practices in hotel operations, (ii) distribution, (iii) marketing and loyalty initiatives, (iv) low-cost procurement and (v) expansion and growth strategies, which help to drive return on their investment. We believe our ability to fulfill the needs of our franchisees is reflected in our franchisee retention, which is consistently high. We retain approximately 94% of our total properties each year.
A key element of our value proposition to franchisees is reservation delivery and profit optimization. Our cloud-based, web-enabled, state-of-the-art technology platform, which includes a fully integrated property management, reservation and revenue management system, is provided to our franchisees at an affordable price. We provide our franchisees with the types of tools used by larger hotels, a capability that was effectively unaffordable to hotels in the economy and midscale sectors. Our scale enables franchisees to take advantage of attractive pricing, and this cloud-based, web-enabled solution eliminates the need for our franchisees to purchase or maintain an on-site server, which traditionally has been a significant burden to hotel owners.
Our reservation system is designed so that our franchisees have easy and fast access to incremental distribution channels. Using our fully automated and extensive partner network, we distribute rates and inventory through thousands of offline and online channels and connect to all major global distribution systems and online travel agencies, enabling our franchisees to leverage our scale to drive incremental bookings. We also offer around-the-clock handling of direct-to-property reservation calls for our franchisees. Our call center agents book reservations at a meaningful ADR premium as compared to direct-to-property reservation calls, enabling our franchisees to optimize revenue while reducing staffing costs.
As of December 31, 2018, our franchising portfolio, excluding managed properties, consisted of 8,717 hotels representing 742,800 rooms, which comprised 92% of our total system.
During 2018, we generated $1,135 million of revenue from franchising activities, which represented approximately 89% of our total revenue (excluding cost reimbursements). Our franchise fees include (i) ongoing royalties that are generally calculated as a percentage of gross room revenue and permit the hotel owners and operators to use certain of the trademarks associated with our brand names, (ii) initial franchise fees, which relate to services provided to assist a franchised hotel to open under one of our brands, (iii) other franchise fees, which include franchise renewal fees, transfer fees and early termination fees, (iv) marketing, loyalty and reservation fees, which are intended to reimburse us for marketing and
reservation activities, as well as loyalty member redemptions and program administration and (v) royalties derived from licensing our “Wyndham” trademark and certain other trademarks and intellectual property to Wyndham Destinations.
Other revenues generated from franchising activities include licensing fees, credit card program revenue and procurement services. We earn revenue from a license, development and noncompetition agreement with Wyndham Destinations primarily for the use by Wyndham Destinations of our “Wyndham” trademark and certain other trademarks and intellectual property, for which Wyndham Destinations will pay us certain royalties and other fees. The term of the license agreement is 100 years. (See “Relationship with Wyndham Destinations.”) We earn revenue from our co-branded Wyndham Rewards Visa credit card program, which is primarily generated by cardholder spending activity and the enrollment of new cardholders. We also earn procurement services revenue from qualified vendors which is generated based on the level of goods and services purchased by franchisees and hotel guests from these qualified vendors.
Our Hotel Management Business
By providing management services, we are able to appeal to hotel owners who may lack hotel operating capabilities and want a single-source solution for brand and management. We make decisions to manage hotels based on the strategic value that doing so would add to our hotel brands, concentrating on brand and market location and the operating experience of the hotel owner. Internationally, particularly in developing markets, offering management services to hotel owners and developers is a prerequisite to successfully expand our presence in a region. Under our management arrangements, we provide all the benefits of a franchising agreement and also conduct the day-to-day-operations of the hotel on behalf of the owner. For the majority of hotels that we manage, we are responsible for the hiring, training and supervision of all hotel associates.
The duration of our management agreements is typically 10 to 20 years. We earn a base management fee, which is based on a percentage of the hotel’s total revenue, and in some cases we earn an incentive fee, which is based on achieving performance metrics agreed upon with hotel owners. As of December 31, 2018, we had 438 hotels under management contracts and two owned hotels – the Wyndham Grand Rio Mar Beach Resort and Spa in Puerto Rico and the Wyndham Grand Orlando Bonnet Creek. We manage hotels primarily under the Wyndham, Wyndham Grand, La Quinta, Dolce, TRYP, Hawthorn, Wingate, Ramada, Esplendor and Dazzler brands in major markets and resort destinations globally.
Our development team is focused on growing our presence in top U.S. markets with properties and hotel owners who will raise the profile and performance of our hotel brands, which will better position us to win future franchise and management contracts under our hotel brands. Our international development efforts are focused on building scale in key cities and markets, improving our hotel brand recognition and broadening our appeal to domestic and international guests.
During 2018, we generated $140 million of revenue from our hotel management business excluding $586 million of cost reimbursements, which is 11% of our total revenue (excluding such cost reimbursements). Hotel management revenues are comprised of (i) base fees, which are typically a percentage of the total hotel revenues, (ii) incentive fees, which are typically a percentage of hotel profitability, and (iii) for our two owned hotels, gross room revenue, food and beverage services revenue and other amenity service revenue, such as from spa, casino and golf offerings. Other revenue sources generated from hotel management activities include service fees, which include fees derived from accounting, design, construction and purchasing services and technical assistance provided to managed hotels. We also record revenue for cost reimbursements. These are reimbursable payroll-related costs for operational employees and other reimbursable costs at certain of our managed hotels. These costs are funded by hotel owners but the accounting rules require us to report these fees on a gross basis as both revenue and expense. We do not mark up these costs, and as such, the revenue and related expense have no impact on our operating income or net income.
Competition
We encounter competition among hotel franchisors and lodging operators. We believe franchisees make decisions based principally upon the perceived value and quality of the brand and the services offered. We further believe that the perceived value of a brand name is partially a function of the success of the existing hotels franchised under the brand.
The ability of an individual franchisee to compete may be affected by the location and quality of its property, the number of competitors in the vicinity, community reputation and other factors. A franchisee’s success may also be affected by general, regional and local economic conditions. The potential effect of these conditions on our performance is substantially reduced by virtue of the diverse locations of our affiliated hotels and by the scale of our base. Our system is dispersed among approximately 5,900 franchisees, which reduces our exposure to any one franchisee. One master franchisor in China accounts for 13% of our hotels. Apart from this relationship, no one franchisee accounts for more than 4% of our hotels.
Relationship with Wyndham Destinations
We maintain a significant relationship with Wyndham Destinations, which operates the world’s largest vacation ownership and vacation exchange businesses. Wyndham Hotels continues to own the trademarks and other intellectual property rights related to our hotel brands, including the “Wyndham” trademark, and collects a royalty from Wyndham Destinations for use of the “Wyndham” trademark, “The Registry Collection” trademark and certain other trademarks and intellectual property, under a long-term license, development and noncompetition agreement. Under a Transition Services Agreement, Wyndham Destinations and Wyndham Hotels provide transitional services to each other for, among other things, finance, information technology, human resources, payroll, tax and other services for a limited time to help ensure an orderly transition following our spin-off. Under a Marketing Services Agreement, Wyndham Hotels provides certain marketing-related services to Wyndham Destinations, including sharing certain post-stay reservation data and Wyndham Rewards loyalty program data for marketing purposes and providing telephone and email marketing support services. Additionally, Wyndham Hotels and Wyndham Destinations entered into agreements relating to participation in the Wyndham Rewards loyalty program and the co-branded Wyndham Rewards Visa credit card program.
Seasonality
While the hotel industry is seasonal in nature, periods of higher revenues vary property-by-property and performance is dependent on location and guest base. Based on historical performance, revenues from franchise and management fees are generally higher in the second and third quarters than in the first or fourth quarters due to increased leisure travel during the spring and summer months. The seasonality of our business may cause fluctuations in our quarterly operating results, earnings and profit margins. As we expand into new markets and geographical locations, we may experience increased or different seasonality dynamics that create fluctuations in operating results different from the fluctuations we have experienced in the past.
Intellectual Property
Wyndham Hotels owns the trademarks and other intellectual property rights related to our hotel brands, including the “Wyndham” trademark. We actively use, directly or through our licensees, these trademarks and other intellectual property rights. We operate in a highly competitive industry in which the trademarks and other intellectual property rights related to our hotel brands are very important to the marketing and sales of our services. We believe that our hotel brand names have come to represent high standards of quality, caring, service and value to our franchisees and guests. We register the trademarks that we own in the United States Patent and Trademark Office, as well as with other relevant authorities, where we deem appropriate, and otherwise seek to protect our trademarks and other intellectual property rights from unauthorized use as permitted by law.
Government Regulation
Our business is subject to various foreign and U.S. federal and state laws and regulations. In particular, our franchisees are subject to the local laws and regulations in each country in which such hotels are operated, including employment laws and practices, privacy laws and tax laws, which may provide for tax rates that exceed those of the United States and which may provide that our foreign earnings are subject to withholding requirements or other restrictions, unexpected changes in regulatory requirements or monetary policy and other potentially adverse tax consequences. Our franchisees and other aspects of our business are also subject to various foreign and U.S. federal and state laws and regulations, including the Americans with Disabilities Act and similar legislation in certain jurisdictions outside of the United States.
The Federal Trade Commission, various states and other foreign jurisdictions regulate the offer and sale of franchises. The Federal Trade Commission requires us to furnish to prospective franchisees a franchise disclosure document containing prescribed information prior to execution of a binding franchise agreement or payment of money by the prospective franchisee. State regulations also require franchisors to make extensive disclosure to prospective franchisees, and a number of states also require registration of the franchise disclosure document prior to sale of any franchise within the state. Non-compliance with disclosure and registration laws can affect the timing of our ability to sell franchises in these jurisdictions. Additionally, laws in many states and foreign jurisdictions also govern the franchise relationship, such as imposing limits on a franchisor’s ability to terminate franchise agreements or to withhold consent to the renewal or transfer of these agreements. Failure to comply with these laws and regulations has the potential to result in fines, injunctive relief, and/or payment of damages or restitution to individual franchisees or regulatory bodies, or negative publicity impairing our ability to sell franchises.
In addition, our business operations in countries outside the United States are subject to a number of laws and regulations, including restrictions imposed by the Foreign Corrupt Practices Act, as well as trade sanctions administered by the Office of Foreign Assets Control. The Foreign Corrupt Practices Act is intended to prohibit bribery of foreign officials and requires us to keep books and records that accurately and fairly reflect our transactions. The Office of Foreign Assets Control administers and enforces economic and trade sanctions based on U.S. foreign policy and national security goals against targeted foreign states, organizations and individuals. In addition, some of our operations may be subject to additional laws and regulations of non-U.S. jurisdictions, including the U.K.’s Bribery Act 2010, which contains significant prohibitions on bribery and other corrupt business activities, and other local anti-corruption laws in the countries and territories in which we conduct operations.
Employees
As of December 31, 2018, we had approximately 16,200 employees, including approximately 1,200 employees outside of the United States. Approximately 7% of our employees are subject to collective bargaining agreements governing their employment with our Company.
Legal Proceedings
We are involved in various claims and lawsuits arising in the ordinary course of business, none of which, in the opinion of management, is expected to have a material adverse effect on our results of operations or financial condition. See Note 13 - Commitments and Contingencies to our audited Consolidated and Combined Financial Statements for a description of claims and legal actions arising in the ordinary course of our business.
Item 1A. Risk Factors.
RISK FACTORS
You should carefully consider each of the following risk factors and all of the other information set forth in this report. The risk factors generally have been separated into three groups: risks relating to our business and industry, risks relating to the spin-off and risks relating to our common stock. Based on the information currently known to us, we believe that the following information identifies the most significant risk factors affecting our Company in each of these categories of risks. However, the risks and uncertainties we face are not limited to those set forth in the risk factors described below. Additional risks and uncertainties not presently known to us or that we currently believe to be immaterial may also adversely affect our business. In addition, past financial performance may not be a reliable indicator of future performance and historical trends should not be used to anticipate results or trends in future periods.
If any of the following risks and uncertainties develops into actual events, these events could have a material adverse effect on our business, financial condition or results of operations. In such case, the trading price of our common stock could decline.
Risks Relating to Our Business and Industry
The hotel industry is highly competitive and we are subject to risks related to competition that may adversely affect our performance and growth.
We will be adversely impacted if we cannot compete effectively in the highly competitive hotel industry. Our continued success depends upon our ability to compete effectively in markets that contain numerous competitors, some of whom may have significantly greater financial, marketing and other resources than we have. Competition in the hotel industry is based primarily on brand name recognition and reputation, as well as location, room rates, property size and availability of rooms and conference space, quality of the accommodations, guest satisfaction, amenities and the ability to earn and redeem loyalty program points. We compete with other hotel franchisors for franchisees and we may not be able to grow our franchise system. New hotels may be constructed and these additions to supply create new competitors, in some cases without corresponding increases in demand for lodging. Competition may reduce fee structures, potentially causing us to lower our fees, which may adversely impact our profits. New competition or existing competition that employs a business model that is different from our business model may require us to change our model so that we can remain competitive.
We are subject to business, financial, operating and other risks common to the hotel, hotel franchising and hotel management industries and which affect our franchisees, any of which could reduce our revenues and growth.
A significant portion of our revenue is derived from fees based on room revenues at hotels franchised under our hotel brands. As such, our business is subject, directly or through our franchisees, to risks common in the hotel, hotel franchising and hotel management industries, including risks related to:
| |
• | our ability to meet our objectives for growth in the number of our franchised hotels, hotel rooms in our franchise system and hotels under management and to retain franchisees and hotel management contracts; |
| |
• | the number, occupancy and room rates of hotels operating under our franchise and management agreements; |
| |
• | the delay of hotel openings in our pipeline; |
| |
• | the supply and demand for hotel rooms; |
| |
• | our ability to develop and maintain positive relations and contractual arrangements with current and potential franchisees and hotel owners under our hotel management agreements; |
| |
• | competition from other franchised hotel brands, which may require us to offer terms to prospective franchisees and hotel owners less favorable to us than current franchise agreements; |
| |
• | our franchisees’ pricing decisions, which may indirectly affect our revenues; |
| |
• | the quality of the services provided by franchisees, which may adversely affect our image, reputation and brand value for both prospective guests and prospective franchisees and hotel owners; |
| |
• | our ability to successfully market our rewards program and the level of participation in the program by our franchisees and guests; |
| |
• | the bankruptcy or insolvency of a significant number of our franchised or managed hotels, which could impair our ability to collect outstanding fees or other amounts due or otherwise exercise our contractual rights and result in the early termination of our contracts; |
| |
• | the availability of financing to allow prospective franchisees to build new hotels; |
| |
• | financial difficulties of franchisees, owners or other developers that have development advance notes with us or who have received loans or other financial incentives from us; |
| |
• | disputes with franchisees, which may result in litigation and the loss of management contracts; |
| |
• | the failure of our franchisees to make investments necessary to maintain or improve their properties; |
| |
• | adverse events occurring at one of our franchisees’ locations, such as personal injuries, food tampering, contamination or the spread of illness; |
| |
• | negative publicity from online social media postings and related media reports, which could damage our hotel brands; |
| |
• | our ability to successfully market our hotel brands, programs or service or pilot new initiatives; |
| |
• | our management contract with CorePoint Lodging, Inc. (“CorePoint”), which in aggregate owns approximately 71% of our managed hotels; |
| |
• | the laws, regulations and legislation internationally and domestically, and on a federal, state or local level, concerning the franchise or hotel industry, which may make franchising or managing hotels more onerous, more expensive or less profitable; |
| |
• | our failure to adequately protect and maintain our trademarks and other intellectual property rights; |
| |
• | competition from short-term online rental properties and agencies; |
| |
• | the relative mix of branded hotels in the various hotel industry price categories; |
| |
• | corporate budgets and spending and cancellations, deferrals or renegotiations of group business; |
| |
• | seasonal volatility in our business; |
| |
• | operating costs, including as a result of inflation, energy costs and labor costs such as minimum wage increases and unionization, workers’ compensation and health-care related costs and insurance; |
| |
• | our ability to keep pace with technological developments, which could impair our competitive position; |
| |
• | disruptions, including non-renewal or termination of agreements, in relationships with third parties; including marketing alliances and affiliations with e-commerce channels; and |
| |
• | disputes concerning our operations, including consumer disputes, organized labor activities, class actions and associated litigation. |
Any of these factors could reduce our revenues, increase our costs or otherwise limit our opportunities for growth.
Declines in or disruptions to the travel industry, such as those caused by economic conditions, terrorism, political strife, pandemics or threats of pandemics, acts of God and war, may adversely affect us.
Declines in or disruptions to the travel and hotel industries may adversely impact us. Risks affecting the travel and hotel industries include: economic slowdown and recession; economic factors such as increased costs of living and reduced discretionary income adversely impacting decisions by consumers and businesses to use travel accommodations; terrorist incidents and threats and associated heightened travel security measures; political and regional strife; acts of God such as
earthquakes, hurricanes, fires, floods, volcanoes and other natural disasters; war; concerns with or threats of pandemics, contagious diseases or health epidemics; environmental disasters; lengthy power outages; increased pricing, financial instability and capacity constraints of air carriers; airline job actions and strikes; and increases in gasoline and other fuel prices. Any such disruptions to the travel or hotel industries may adversely affect our franchised hotels, the operations of current and potential franchisees, developers and owners of hotels with which we have hotel management contracts.
Third-party Internet reservation systems, peer-to-peer online networks and alternative lodging channels may adversely impact us.
Consumers increasingly use third-party Internet travel intermediaries and peer-to-peer online networks to search for and book their lodging accommodations. As the percentage of internet reservations increases, travel intermediaries may be able to obtain higher commissions and reduced room rates to the detriment of our business. Additionally, such travel intermediaries may divert reservations away from our direct online channels or increase the overall cost of Internet reservations for our affiliated hotels through their fees. As the use of these third-party reservation channels and peer-to-peer online networks increases, consumers may rely on these channels, adversely impacting our hotel brands, reservations and rates. In addition, if we fail to reach satisfactory agreements with intermediaries, our affiliated hotels may not appear on their websites and we could lose business as a result.
In addition to competing with traditional hotels and lodging facilities, our franchisees compete with alternative lodging channels, including third-party providers of short-term rental properties and serviced apartments. Increasing use of these alternative lodging channels could materially adversely affect the occupancy and/or average rates at franchised hotels and our revenues.
We may be unable to enter into new, or renew existing, hotel management arrangements on favorable terms or at all, and certain of our management agreements require that we fund shortfalls, any of which could reduce our revenue and the growth of our hotel management business.
We provide hotel management services to certain of our hotel owners. Our current and future management arrangements may not continue and we may not be able to enter into new management arrangements in the future on favorable terms. Some of our management contracts with hotel owners require that we compensate the hotel owners for any shortfalls over the life of the management agreement up to a specified aggregate amount if the hotels do not attain specified levels of operating profit or owners do not receive a guaranteed minimum income. We may not be able to recover any funding of such performance guarantees. Any such factors could reduce our revenue and the growth of our hotel management business.
The anticipated benefits of the acquisition of La Quinta’s hotel franchising and management businesses may not be realized fully and may take longer to realize than expected.
The acquisition of La Quinta’s hotel franchising and management businesses involves the integration of two companies that have previously operated independently. The integration of the two companies may not result in the realization of the full benefits of synergies, cost savings, innovation and operational efficiencies that we expect to realize or these benefits may not be achieved within a reasonable period of time.
The difficulties of integration include: integrating the acquired hotel franchising and management businesses of La Quinta into Wyndham Hotels; implementing our business plan for the combined company; integrating information, communications and other systems and internal controls over accounting and financial reporting; consolidating corporate and administrative functions; conforming standards, controls, procedures and policies, business cultures and compensation structures between Wyndham Hotels and La Quinta’s hotel franchising and management businesses; retaining franchisees; establishing a mutually beneficial relationship with CorePoint; and retaining key personnel.
Our ability to achieve the anticipated benefits of the La Quinta acquisition will depend in part on our relationship with CorePoint.
In connection with the La Quinta acquisition, we have entered into agreements with CorePoint that will govern the ongoing relationships between CorePoint and us. These agreements, among other things, include arrangements with respect to employee matters, tax matters, transitional services and hotel management and franchise matters, as well as the allocations of assets and liabilities, rights and indemnification and other obligations between us and CorePoint. Our success will depend, in part, on the maintenance of these relationships with CorePoint and its performance of its obligations under these agreements. If we are unable to maintain a good relationship with CorePoint, if it does not perform its obligations under these agreements or does not renew such agreements following their expiration, or if the CorePoint spin-off exposes us to liabilities and legal proceedings, our profitability and revenues could decrease, we may not realize the anticipated benefits of the La Quinta acquisition and our growth potential may be adversely affected.
Our success depends in part on Wyndham Destinations’ sales of vacation membership interests and our ongoing relationship with Wyndham Destinations.
In connection with the spin-off, we entered into a number of agreements with Wyndham Destinations that govern our ongoing relationship with Wyndham Destinations. Our success depends, in part, on the maintenance of our ongoing relationship with Wyndham Destinations, Wyndham Destinations’ performance of its obligations under these agreements, including Wyndham Destinations’ maintenance of the quality of products and services it sells under the “Wyndham” trademark, and certain other trademarks and intellectual property that we license to Wyndham Destinations. Under the license, development and noncompetition agreement, Wyndham Destinations pays us significant royalties and other fees based on the volume of Wyndham Destinations’ sales of vacation ownership interests and other vacation products and services. Wyndham Destinations competes with other vacation ownership companies for sales of vacation ownership interests based on resort locations, quality of accommodations and service, price, financing availability, ability to exchange for time at other resorts, and brand name recognition and reputation. If Wyndham Destinations is unable to compete effectively for sales of vacation ownership interests, our royalty fees under the license, development and non-competition agreement could be adversely impacted. If we are unable to maintain a good relationship with Wyndham Destinations, or if Wyndham Destinations does not perform its obligations under these agreements, fails to maintain the quality of the products and services it sells under the “Wyndham” trademark and certain other trademarks or fails to pay such royalties, our earnings could decrease.
Our international operations are subject to additional risks not generally applicable to our domestic operations.
Our international operations are subject to numerous risks including: exposure to local economic conditions; potential adverse changes in the diplomatic relations of foreign countries with the United States; hostility from local populations; political instability, including potential disruptions from the United Kingdom’s exit from the European Union, trade disputes with China and other geopolitical risks; threats or acts of terrorism; the effect of disruptions caused by severe weather, natural disasters, outbreak of disease or other events that make travel to a particular region less attractive or more difficult; the presence and acceptance of varying levels of business corruption in international markets; restrictions and taxes on the withdrawal of foreign investment and earnings; government policies against businesses or properties owned by foreigners; investment restrictions or requirements; diminished ability to legally enforce our contractual rights in foreign countries; forced nationalization of hotel properties by local, state or national governments; foreign exchange restrictions; fluctuations in foreign currency exchange rates; conflicts between local laws and U.S. laws including laws that impact our rights to protect our intellectual property; withholding and other taxes on remittances and other payments by subsidiaries; and changes in and application of foreign taxation structures including value added taxes. Any adverse outcome resulting from the financial instability or performance of foreign economies, the instability of other currencies and the related volatility on foreign exchange and interest rates could impact our results of operations, financial position or cash flows.
Changes in U.S. federal, state and local or foreign tax law, interpretations of existing tax law or adverse determinations by tax authorities could increase our tax burden or otherwise adversely affect our financial condition or results of operations.
We are subject to taxation at the federal, state and local levels in the United States and various other countries and jurisdictions. Our future effective tax rate and cash flows could be affected by changes in the composition of earnings in jurisdictions with differing tax rates, changes in statutory rates and other legislative changes, changes in the valuation of our deferred tax assets and liabilities, changes in determinations regarding the jurisdictions in which we are subject to tax, and our ability to repatriate earnings from foreign jurisdictions. From time to time, U.S. federal, state and local and foreign governments make substantive changes to tax rules and their application, which could result in materially higher corporate taxes than would be incurred under existing tax law and could adversely affect our financial condition or results of operations. We are subject to ongoing and periodic tax audits and disputes in U.S. federal and various state, local and foreign jurisdictions. An unfavorable outcome from any tax audit could result in higher tax costs, penalties and interest, thereby adversely affecting our financial condition or results of operations.
In addition, we are directly and indirectly affected by new tax legislation and regulation and the interpretation of tax laws and regulations worldwide. Changes in such legislation, regulation or interpretation could increase our taxes and have an adverse effect on our operating results and financial condition. This includes potential changes in tax laws or the interpretation of tax laws arising out of the Base Erosion Profit Shifting project initiated by the Organization for Economic Co-operation and Development.
We are subject to risks related to our debt, hedging transactions, the cost and availability of capital and the extension of credit by us.
As of December 31, 2018, we had aggregate outstanding debt of $2,141 million. Since the consummation of the spin-off, we have been responsible for servicing our own debt and obtaining and maintaining sufficient working capital and other funds to satisfy our cash requirements. Our debt instruments contain restrictions, covenants and events of default that, among other things, could limit our ability to respond to market conditions, provide for capital investment needs or take advantage of business opportunities by restricting our ability to incur or guarantee additional debt or requiring us to offer to repurchase our debt in the event of a change of control or a change of control triggering event; pay dividends or make distributions; make investments or acquisitions; sell, transfer or otherwise dispose of certain assets; create liens; consolidate or merge; enter into transactions with affiliates; and prepay and repurchase or redeem certain indebtedness. We may also incur substantial additional indebtedness in the future. If we incur additional debt, the risks related to our debt may intensify.
We extend credit when we provide development advance notes and mezzanine or other forms of subordinated financing to assist franchisees and hotel owners in converting to or building a new hotel under one of our hotel brands. We may use financial instruments to reduce or hedge our financial exposure to the effects of currency and interest rate fluctuations. In connection with our debt obligations, hedging transactions, the cost and availability of capital and the extension of credit by us, we are subject to numerous risks including:
| |
• | our cash flows from operations or available lines of credit may be insufficient to meet required payments of principal and interest, which could result in a default and acceleration of the underlying debt and under other debt instruments that contain cross-default provisions; |
| |
• | we may be unable to comply with the terms of the financial covenants under our debt instruments which could result in a default and acceleration of the underlying debt and under other debt instruments that contain cross-default provisions; |
| |
• | our leverage may adversely affect our ability to obtain additional financing on favorable terms or at all; |
| |
• | our leverage may require the dedication of a significant portion of our cash flows to the payment of principal and interest, thus reducing the availability of cash flows to fund working capital, capital expenditures, dividends, share repurchases and other operating needs; |
| |
• | increases in interest rates may adversely affect our financing costs and result in increases in our hedging costs; |
| |
• | rating agency downgrades of our debt could increase our borrowing costs and prevent us from obtaining additional financing on favorable terms or at all; |
| |
• | failure or non-performance of counterparties to foreign exchange and interest rate hedging transactions could result in losses; and |
| |
• | the inability of franchisees that have received mezzanine and other loans from us to pay back such loans. |
Our access to credit and capital also depends in large measure on market liquidity factors, which we do not control. Our ability to access the credit and capital markets may be restricted at times when we require or want access, which could impact our business plans and operating model. Uncertainty or volatility in the equity and credit markets may also negatively affect our ability to access short-term and long-term financing on reasonable terms or at all, which would negatively impact our liquidity and financial condition. In addition, if one or more of the financial institutions that support our credit facilities fail, we may not be able to find a replacement, which would negatively impact our ability to borrow under the credit facilities. Disruptions in the financial markets may adversely affect our credit rating and the market value of our common stock. While we believe we have adequate sources of liquidity to meet our anticipated requirements for working capital, debt service and capital expenditures for the foreseeable future, if we are unable to refinance or repay our outstanding debt when due, our results of operations and financial condition will be materially and adversely affected.
Changes to estimates or projections used to assess the fair value of our assets or operating results that are lower than our current estimates may cause us to incur impairment losses and require us to write-off all or a portion of the remaining value of our goodwill or other intangibles of companies we have acquired.
Our total assets include goodwill and other intangible assets. We evaluate our goodwill for impairment on an annual basis or at other times during the year if events or circumstances indicate that it is more likely than not that the fair value is below the carrying value. We may be required to record a significant non-cash impairment charge in our financial statements during the period in which any impairment of our goodwill, other intangible assets or other assets is determined, negatively impacting our results of operations and stockholders’ equity.
Acquisitions and other strategic transactions may not prove successful and could result in operating difficulties and failure to realize anticipated benefits.
We regularly consider a wide array of acquisitions and other potential strategic transactions, including acquisitions of hotel brands, businesses and real property, joint ventures, business combinations, strategic investments and dispositions. Any of these transactions could be material to our business. We often compete for these opportunities with third parties, which may cause us to lose potential opportunities or to pay more than we may otherwise have paid absent such competition. We may not be able to identify and consummate strategic transactions and opportunities on favorable terms and any such strategic transactions or opportunities, if consummated, may not be successful.
We are subject to risks related to litigation.
We are subject to a number of claims and legal proceedings and the risk of future litigation as described in this report. We cannot predict with certainty the ultimate outcome and related liability and costs of litigation and other proceedings filed by or against us. Unfavorable rulings or outcomes in litigation and other proceedings may materially harm our business.
Our operations are subject to extensive regulation and the cost of compliance or failure to comply with regulations may adversely affect us.
Our operations are regulated by federal, state and local governments in the countries in which we operate. In addition, U.S. and international federal, state and local regulators may enact new laws and regulations that may reduce our revenues, cause our expenses to increase or require us to modify our business practices substantially. If we are not in compliance with applicable laws and regulations, including, among others, those governing franchising, hotel operations, lending, information security, data protection and privacy (including the General Data Protection Regulation), credit card security standards, marketing, sales, consumer protection and advertising, unfair and deceptive trade practices, fraud, bribery and corruption, telemarketing (including do-not-call and call-recording regulations), licensing, labor, employment, anti-discrimination, health care, health and safety, accessibility, immigration, gaming, environmental, intellectual property, securities, stock exchange listing, accounting, tax and regulations applicable under the Dodd-Frank Act, the Office of Foreign Asset Control, the Americans with Disabilities Act, the Sherman Act, the Foreign Corrupt Practices Act and local equivalents in international jurisdictions, including the United Kingdom Bribery Act, we may be subject to regulatory investigations or actions, fines, civil and/or criminal penalties, injunctions and potential criminal prosecution.
While we continue to monitor all such laws and regulations, the cost of compliance with such laws and regulations impacts our operating costs. Future changes to such laws and regulations and the cost of compliance or failure to comply with such regulations may adversely affect us.
Failure to maintain the security of personally identifiable and proprietary information, non-compliance with our contractual obligations regarding such information or a violation of our privacy and security policies with respect to such information could adversely affect us.
In connection with our business, we and our service providers collect and retain large volumes of certain types of personal and proprietary information pertaining to guests, stockholders and employees. Such information includes, but is not limited to, large volumes of guest credit and payment card information. We are at risk of attack by cyber-criminals operating on a global basis attempting to gain access to such information. In connection with data security incidents involving a group of Wyndham brand hotels that occurred between 2008 and 2010, one of our subsidiaries is subject to a stipulated order with the U.S. Federal Trade Commission (the “FTC”), pursuant to which, among other things, it is required to maintain an information security program for payment card information within its network, and which provides it with a safe harbor provided it continues to meet certain requirements for reasonable data security as outlined in the stipulated order.
While we maintain what we believe are reasonable security controls over personal and proprietary information, including the personal information of guests, stockholders and employees, a breach of or breakdown in our systems that results in the unauthorized release of personal or proprietary information could nevertheless occur or our subsidiary could fail to comply with the stipulated order with the FTC, any of which could have a material adverse effect on our hotel brands, reputation, business, financial condition and results of operations, as well as subject us to significant regulatory actions and fines, litigation, losses, third-party damages and other liabilities. Such a breach or a breakdown could also materially increase our costs to protect such information and to protect against such risks.
Additionally, the legal and regulatory environment surrounding information security and privacy in the U.S. and international jurisdictions is constantly evolving. Should we violate or not comply with any of these laws or regulations,
contractual requirements relating to data security and privacy, or with our own privacy and security policies, either intentionally or unintentionally, or through the acts of intermediaries, it could have a material adverse effect on our hotel brands, reputation, business, financial condition and results of operations, as well as subject us to significant fines, litigation, losses, third-party damages and other liabilities.
Our information technology infrastructure, including but not limited to our, and our third-party service providers’, information systems and legacy proprietary online reservation and management systems, may be vulnerable to system failures, computer hacking, cyber-terrorism, computer viruses and other intentional or unintentional interference, negligence, fraud, misuse and other unauthorized attempts to access or interfere with these systems and our personal and proprietary information. The increased scope and complexity of our information technology infrastructure and systems could contribute to the potential risk of security breaches or breakdown.
We rely on information technologies and systems to operate our business, which involves reliance on third-party service providers and on uninterrupted operation of service facilities.
We rely on information technologies and systems to operate our business, which involves reliance on third-party service providers and uninterrupted operations of service facilities, including those used for reservation systems, hotel/property management, communications, procurement, call centers, operation of our loyalty programs and administrative systems. We also maintain physical facilities to support these systems and related services. Any natural disaster, disruption or other impairment in our technology capabilities and service facilities or those of our vendors could harm our business. Any failure of our ability to provide our reservation systems may deter prospective franchisees or hotel owners from entering into agreements with us, and may expose us to liability from existing franchisees or other parties with whom we have contracted to provide reservation services. As we transition from our legacy systems to new, cloud-based technologies, we may face start-up issues that may negatively impact guests. In addition, failure to keep pace with developments in technology could impair our operations or competitive position.
We are dependent on our senior management and the loss of any member of our senior management could harm our business.
We believe that our future growth depends in part on the continued services of our senior management team. Losing the services of any members of our senior management team could adversely affect our strategic relationships and impede our ability to execute our business strategies. The market for qualified individuals may be highly competitive and finding and recruiting suitable replacements for senior management may be difficult, time-consuming and costly.
The insurance we carry may not always pay, or be sufficient to pay or reimburse us, for our liabilities, losses or replacement costs.
We carry insurance for general liability, property, business interruption and other insurable risks with respect to our business and franchised, managed and owned hotels. We also self-insure for certain risks up to certain monetary limits. The terms and conditions or the amounts of coverage of our insurance may not at all times be sufficient to pay or reimburse us for the amount of our liabilities, losses or replacement costs, and there may also be risks for which we do not obtain insurance in the full amount or any amount concerning a potential loss or liability, or at all, due to the cost or availability of such insurance. As a result, we may incur liabilities or losses in the operation of our business that are substantial, which are not sufficiently covered by the insurance we maintain, or at all, which could have a material adverse effect on our business, financial condition and results of operations.
We are subject to risks related to corporate social responsibility.
Many factors influence our reputation and the value of our hotel brands including the perception held by guests, our franchisees, our other key stakeholders and the communities in which we do business. Our business faces increasing scrutiny related to environmental, social and governance activities and the risk of damage to our reputation and the value of our hotel brands if we fail to act responsibly or comply with regulatory requirements in a number of areas, such as safety and security, responsible tourism, environmental stewardship, supply chain management, climate change, modern slavery, diversity, human rights, philanthropy and support for local communities.
Risks Relating to the Spin-Off
We may be unable to achieve some or all of the benefits that we expect to achieve from our spin-off from Wyndham Destinations.
As a result of our separation from Wyndham Destinations we may be more susceptible to market fluctuations and other adverse events than we would have been were we still a part of Wyndham Destinations. If we fail to achieve some or all of the benefits that we expect to achieve as an independent company, or do not achieve them in the time we expect, our results of operations and financial condition could be materially adversely affected.
We have a limited operating history as a separate public company, our financial information from before the spin-off from Wyndham Destinations may not reflect our current or future results as an independent company, we may not be able to make, on a timely or cost-effective basis, the changes necessary to operate as an independent company and, as a result, we may experience increased costs.
Prior to the spin-off, Wyndham Destinations performed various corporate functions for us, including tax administration, governance, compliance, accounting, internal audit and external reporting. Our historical financial results reflect allocations of corporate expenses from Wyndham Destinations for these and similar functions that may be less than the comparable expenses we would have incurred had we operated as a separate publicly traded company. Prior to the spin-off, we shared with Wyndham Destinations economies of scope and scale in costs, employees, vendor relationships and relationships with our guests. Although we entered into transition agreements and licensing, marketing and other agreements that govern certain commercial and other relationships between us and Wyndham Destinations, those arrangements may not capture the benefits our business enjoyed as a result of being integrated with the other businesses of Wyndham Destinations prior to the spin-off.
Generally, our working capital requirements, including acquisitions and capital expenditures, were satisfied as part of the corporate-wide cash management policies of Wyndham Destinations before the spin-off. Since the completion of the spin-off, Wyndham Destinations has not and will not be providing us with funds to finance our working capital or other cash requirements, and we may need to obtain financing from banks, through public offerings or private placements of debt or equity securities, strategic relationships or other arrangements. We may be unable to replace in a timely manner or on comparable terms and costs the services or other benefits that Wyndham Destinations previously provided to us.
The loss of the benefits from being a part of Wyndham Destinations could have an adverse effect on our business, results of operations and financial condition. Other significant changes may occur in our cost structure, management, financing and business operations as a result of our operating as a company separate from Wyndham Destinations.
We may have received better terms from unaffiliated third parties than the terms we received in our agreements with Wyndham Destinations entered into in connection with the spin-off.
We entered into agreements with Wyndham Destinations related to the spin-off while we were still part of Wyndham Destinations. Accordingly, these agreements may not reflect terms that would have resulted from arm’s-length negotiations among unaffiliated third parties and we may have received better terms from third parties because third parties may have competed with each other to secure our business.
Our failure to maintain effective internal controls or meet the financial reporting and other requirements to which we are now subject could have a material adverse effect on our business and the price of our common stock.
As a result of the spin-off, we are subject to reporting and other obligations under U.S. securities laws and are required to comply with applicable internal controls and reporting requirements. Effective internal and disclosure controls are necessary for us to provide reliable financial reports and effectively prevent fraud and to operate successfully as a public company. If we are unable to maintain adequate financial and management controls, reporting systems, information technology systems and procedures, our ability to comply with the financial reporting requirements and other rules that apply to reporting companies under U.S. securities laws may be impaired. Ineffective internal and disclosure controls could also cause investors to lose confidence in our reported financial information, which would likely have a negative effect on the per share trading price of our common stock.
In connection with the spin-off and Wyndham Destinations’ sale of its European vacation rentals business, we agreed to indemnify Wyndham Destinations and Wyndham Destinations, agreed to indemnify us for certain liabilities, and if we are required to perform under these indemnities or if Wyndham Destinations is unable to satisfy its obligations under these indemnities, our financial results could be negatively affected.
In connection with the spin-off, Wyndham Destinations agreed to indemnify us for certain liabilities, and we agreed to indemnify Wyndham Destinations for certain liabilities, including cross-indemnities that are principally designed to place financial responsibility for the obligations and liabilities of our business with us, and financial responsibility for the obligations and liabilities of Wyndham Destinations’ business with Wyndham Destinations. Should our indemnification obligations exceed applicable insurance coverage, our business, financial condition and results of operations could be adversely affected. Additionally, the indemnities from Wyndham Destinations may not be sufficient to protect us against the full amount of these and other liabilities. Third parties also could seek to hold us responsible for any of the liabilities that Wyndham Destinations has agreed to assume. Even if we ultimately succeed in recovering from Wyndham Destinations any amounts for which we are held liable, we may be temporarily required to bear those losses ourselves. Each of these risks could negatively affect our business, financial condition, results of operations and cash flows.
In May 2018, Wyndham Destination Network, LLC, a subsidiary of Wyndham Destinations, Inc., completed the sale of Wyndham Destinations’ European vacation rentals business. In connection with the sale of the European vacation rentals business, we provided certain post-closing credit support in the form of guarantees, which as of December 31, 2018 were approximately $130 million, to ensure that the business meets the requirements of certain service providers and regulatory authorities. Such post-closing credit support may be enforced or called upon if the European vacation rentals business fails to meet its primary obligation to pay certain amounts when due. The European vacation rentals business has provided an indemnity to Wyndham Destinations in the event that the post-closing credit support is enforced or called upon. Pursuant to the terms of the Separation and Distribution Agreement that was entered into in connection with the spin-off, we assumed one-third and Wyndham Destinations assumed two-thirds of any such losses actually incurred by Wyndham Destinations or us in the event that these credit support arrangements are enforced or called upon by any beneficiary and any amounts paid or received by Wyndham Destinations or us in respect of any indemnification claims made in connection with the sale of the European vacation rentals business.
The contingent liabilities we assumed in connection with the spin-off and Wyndham Destinations’ sale of its European vacation rental business could adversely affect our results of operations and financial condition.
The contingent liabilities we assumed in connection with the spin-off and Wyndham Destinations’ sale of its European vacation rental business could adversely affect our results of operations and financial condition. Pursuant to the Separation and Distribution Agreement, we assumed one-third and Wyndham Destinations assumed two-thirds of certain contingent and other corporate liabilities of Wyndham Destinations, which we refer to in this Report as “shared contingent liabilities,” incurred prior to the spin-off, including liabilities of Wyndham Destinations related to, arising out of or resulting from certain terminated or divested businesses, certain general corporate matters of Wyndham Destinations and any actions with respect to the spin-off brought by any third party. Similarly, in connection with the sale of Wyndham Destinations’ European vacation rental business, Wyndham Hotels assumed one-third and Wyndham Destinations assumed two-thirds of certain shared contingent liabilities and certain shared contingent assets. Such shared contingent assets and shared contingent liabilities include: any amounts paid or received by Wyndham Destinations or us in respect of any indemnification claims made in connection with such sale, any losses actually incurred by Wyndham Destinations or us in connection with the provision of post-closing credit support to the European vacation rental business to ensure that the European vacation rental business meets the requirements of certain service providers and regulatory authorities and any tax assets or liabilities related to such sale. The realization of any of these potential liabilities could have an adverse effect on our business or results of operations.
The spin-off and related transactions may expose us to potential liabilities arising out of state and federal fraudulent conveyance laws and legal distribution requirements.
Although we received a solvency opinion from an investment bank confirming that we and Wyndham Destinations were adequately capitalized immediately after the spin-off, the spin-off could be challenged under various state and federal fraudulent conveyance laws. An unpaid creditor could claim that Wyndham Destinations did not receive fair consideration or reasonably equivalent value in the spin-off, and that the spin-off left Wyndham Destinations insolvent or with unreasonably small capital or that Wyndham Destinations intended or believed it would incur debts beyond its ability to pay such debts as they mature. If a court were to agree with such a plaintiff, then such court could void the spin-off as a fraudulent transfer and could impose a number of different remedies, including, returning our assets or your shares in our company to Wyndham Destinations or providing Wyndham Destinations with a claim for money damages against us in an amount equal to the
difference between the consideration received by Wyndham Destinations and the fair market value of our Company at the time of the spin-off.
Certain of our Directors and executive officers may have actual or potential conflicts of interest because of their ownership of Wyndham Destinations equity or their current or former positions at Wyndham Destinations.
Two of our Directors also serve on the Wyndham Destinations board of directors. This could create, or appear to create, potential conflicts of interest when our or Wyndham Destinations’ management and directors face decisions that could have different implications for us and Wyndham Destinations, including the resolution of any dispute regarding the terms of the agreements governing the spin-off and the relationship between us and Wyndham Destinations, any commercial agreements entered into in the future between us and Wyndham Destinations and the allocation of such directors’ time between us and Wyndham Destinations.
Because of their current or former positions with Wyndham Destinations, some of our executive officers and non-employee Directors own shares of Wyndham Destinations common stock. The continued ownership of Wyndham Destinations common stock by our Directors and executive officers creates or may create the appearance of conflicts of interest when these Directors and executive officers are faced with decisions that could have different implications for us and Wyndham Destinations.
If the spin-off, together with certain related transactions, were to fail to qualify as a reorganization for U.S. federal income tax purposes under Sections 368(a)(1)(D) and 355 of the Code, then our stockholders, we and Wyndham Destinations might be required to pay substantial U.S. federal income taxes including as a result of indemnification under the Tax Matters Agreement.
The spin-off was conditioned upon Wyndham Destinations’ receipt of opinions of its spin-off tax advisors to the effect that, subject to the assumptions and limitations described in the opinions, the spin-off, together with certain related transactions, would qualify as a reorganization for U.S. federal income tax purposes under Sections 368(a)(1)(D) and 355 of the Internal Revenue Code of 1986, as amended (the “Code”), in which no gain or loss would be recognized by Wyndham Destinations or its stockholders, except, in the case of Wyndham Destinations stockholders, for cash received in lieu of fractional shares, which opinions were delivered on the closing date of the spin-off. The opinions of its spin-off tax advisors were based on, among other things, certain assumptions as well as on the continuing accuracy of certain factual representations and statements that we and Wyndham Destinations made to the spin-off tax advisors. In rendering their opinion, the spin-off tax advisors also relied on certain covenants that we and Wyndham Destinations entered into, including the adherence by Wyndham Destinations and us to certain restrictions on our future actions contained in the Tax Matters Agreement. If any of the representations or statements that we or Wyndham Destinations made were or were to become inaccurate or incomplete, or if we or Wyndham Destinations breach any of our covenants, the spin-off and such related transactions might not qualify for such tax treatment. The opinions of the spin-off tax advisors are not binding on the Internal Revenue Service (“IRS”) or a court, and there can be no assurance that the IRS will not challenge the validity of the spin-off and such related transactions as a reorganization for U.S. federal income tax purposes under Sections 368(a)(1)(D) and 355 of the Code eligible for tax-free treatment, or that any such challenge ultimately will not prevail.
In addition, Wyndham Destinations received certain rulings from the IRS (the “IRS Ruling”) regarding certain U.S. federal income tax aspects of transactions related to the spin-off. Although the IRS Ruling generally is binding on the IRS, the continued validity of the IRS Ruling is based upon and subject to the continuing accuracy of factual statements and representations made to the IRS by Wyndham Destinations. The IRS Ruling is limited to specified aspects of the spin-off under Section 361 of the Code and does not represent a determination by the IRS that all of the requirements necessary to obtain tax-free treatment to holders of Wyndham Destinations common stock and to Wyndham Destinations were satisfied.
We are not aware of any facts or circumstances that would cause any such factual statements or representations in the opinions of Wyndham Destinations’ spin-off tax advisers or the IRS Ruling to be incomplete or untrue or cause the facts on which the opinions or the IRS Ruling are based to be materially different from the facts at the time of the spin-off.
If the spin-off does not qualify as a tax-free transaction for any reason, including as a result of a breach of a representation or covenant, Wyndham Destinations would recognize a substantial gain attributable to our hotel business for U.S. federal income tax purposes. In such case, under U.S. Treasury regulations, each member of the Wyndham Destinations consolidated group at the time of the spin-off, including us and certain of our subsidiaries, would be jointly and severally liable for the entire resulting amount of any U.S. federal income tax liability. Additionally, if the distribution of our common stock does not qualify as tax-free under Section 355 of the Code, Wyndham Destinations stockholders will be treated as having received a taxable distribution equal to the value of our stock distributed, treated as a taxable dividend to the extent of
Wyndham Destinations’ current and accumulated earnings and profits, and then would have a tax-free basis recovery up to the amount of their tax basis in their shares, and then would have taxable gain from the sale or exchange of the shares to the extent of any excess.
Our ability to engage in acquisitions and other strategic transactions is subject to limitations because we have agreed to certain restrictions intended to support the tax-free nature of the distribution.
The U.S. federal income tax laws that apply to transactions like the spin-off generally create a presumption that the distribution would be taxable to Wyndham Destinations but not to Wyndham Destinations stockholders if we engage in, or enter into an agreement to engage in, a transaction that would result in a 50% or greater change by vote or by value in our stock ownership during the four-year period beginning two years before the distribution date, unless it is established that the transaction is not pursuant to a plan or series or transactions related to the distribution. U.S. Treasury regulations currently in effect generally provide that whether an acquisition transaction and a distribution are part of a plan is determined based on all of the facts and circumstances, including specific factors listed in the Treasury regulations. In addition, these Treasury regulations provide several "safe harbors" for acquisition transactions that are not considered to be part of a plan that includes a distribution.
There are other restrictions imposed on us under current U.S. federal income tax laws with which we will need to comply in order for the spin-off and certain related transactions to qualify as a transaction that is tax-free under Sections 368(a)(1)(D) and 355 of the Code. For example, we are generally required to continue to own and manage our hotel business, and there are limitations on issuances, redemptions and sales of our stock for cash or other property following the distribution, except in connection with certain stock-for-stock acquisitions and other permitted transactions. If these restrictions are not followed, the spin-off could be taxable to Wyndham Destinations and Wyndham Destinations stockholders.
We have entered into a Tax Matters Agreement with Wyndham Destinations under which we have allocated, between Wyndham Destinations and ourselves, responsibility for U.S. federal, state and local and non-U.S. income and other taxes relating to taxable periods before and after the spin-off and provided for computing and apportioning tax liabilities and tax benefits between the parties. In the Tax Matters Agreement, we have agreed that, among other things, we may not take, or fail to take, any action following the spin-off if such action, or failure to act: would be inconsistent with or prohibit the spin-off and certain restructuring transactions related to the spin-off and certain related transactions from qualifying as a tax-free reorganization under Sections 368(a)(1)(D) and 355 and related provisions of the Code to Wyndham Destinations and Wyndham Destinations stockholders except with respect to the receipt of cash in lieu of fractional shares of our stock; or would be inconsistent with, or cause to be untrue, any representation, statement, information or covenant made in connection with the IRS Ruling, the tax opinions provided by Wyndham Destinations’ spin-off tax advisors or the Tax Matters Agreement relating to the qualification of the spin-off and certain related transactions as a tax-free transaction under Sections 368(a)(1)(D) and 355 and related provisions of the Code.
In addition, we have agreed that we may not, among other things, during the two-year period following the spin-off, except under certain specified circumstances, issue, sell or redeem our stock or other securities or those of certain of our subsidiaries; liquidate, merge or consolidate with another person; sell or dispose of assets outside the ordinary course of business or materially change the manner of operating our business; or enter into any agreement, understanding or arrangement, or engage in any substantial negotiations with respect to any transaction or series of transactions which would cause us to undergo a specified percentage or greater change in our stock ownership by value or voting power. These restrictions could limit our strategic and operational flexibility, including our ability to finance our operations by issuing equity securities, make acquisitions using equity securities, repurchase our equity securities, or raise money by selling assets or enter into business combination transactions. We have also agreed to indemnify Wyndham Destinations for certain tax liabilities resulting from any such transactions. Further, our stockholders may consider these covenants and indemnity obligations unfavorable as they might discourage, delay or prevent a change of control.
Risks Relating to Our Common Stock
The trading market price of shares of our common stock may fluctuate widely.
The market price of our common stock may fluctuate widely, depending upon many factors, some of which may be beyond our control, including:
| |
• | success or failure of our business strategies; |
| |
• | failure to achieve our growth and performance objectives; |
| |
• | our quarterly or annual earnings, or those of other companies in our industry; |
| |
• | our ability to obtain financing as needed; |
| |
• | a shift in our investor base; |
| |
• | changes in laws and regulations affecting our business; |
| |
• | changes in accounting standards, policies, guidance, interpretations or principles; |
| |
• | announcements by us or our competitors of significant acquisitions or dispositions; |
| |
• | negative views about our stock or our business expressed by securities analysts; |
| |
• | changes in earnings estimates by securities analysts or our ability to meet those estimates; |
| |
• | the operating and stock price performance of other comparable companies; |
| |
• | overall market fluctuations; |
| |
• | actual or anticipated fluctuations in our operating results due to the seasonality of our business and other factors related to our business; and |
| |
• | general economic conditions. |
These factors may result in short-term or long-term negative pressure on the value of our common stock. Stock markets in general have experienced volatility that has often been unrelated to the operating performance of a particular company. These broad market fluctuations may adversely affect the trading price of our common stock.
Your percentage ownership in Wyndham Hotels may be diluted in the future.
Your percentage ownership in Wyndham Hotels may be diluted in the future because of equity awards that we have and expect will be issued to our Directors and employees and any potential future issuances of stock by us to raise capital or in connection with an acquisition.
Provisions in our amended and restated certificate of incorporation, amended and restated by-laws and Delaware law may prevent or delay an acquisition of Wyndham Hotels, which could decrease the trading price of our common stock.
Our amended and restated certificate of incorporation, amended and restated by-laws and Delaware corporate law contain provisions that are intended to deter or delay coercive takeover practices and inadequate takeover bids. For example, our amended and restated certificate of incorporation and/or amended and restated by-laws will require advance notice for stockholder proposals, place limitations on convening stockholder meetings, authorize our Board to issue one or more series of preferred stock and provide for the classification of our Board of Directors until the third annual meeting of stockholders following the spin-off.
Delaware law also imposes some restrictions on mergers and other business combinations between us and any holder of 15% or more of our outstanding common stock. We believe these provisions protect our stockholders from coercive or otherwise unfair takeover tactics by requiring potential acquirers to negotiate with our Board of Directors and by providing our Board of Directors with more time to assess any acquisition proposal. These provisions are not intended to make us immune from takeovers. However, these provisions apply even if the offer may be considered beneficial by some stockholders and could delay or prevent an acquisition that our Board of Directors determines is not in the best interests of our company and our stockholders.
Our amended and restated by-laws designate the Court of Chancery of the State of Delaware as the sole and exclusive forum for certain types of actions and proceedings that may be initiated by our stockholders, which could limit our stockholders’ ability to obtain a favorable judicial forum for disputes with us or our Directors or employees.
Our amended and restated by-laws provide that, subject to limited exceptions, the Court of Chancery of the State of Delaware will be the sole and exclusive forum for derivative actions; claims related to a breach of a fiduciary duty, corporate law, our certificate of incorporation or our bylaws; or under the internal affairs doctrine. This choice of forum provision may limit a stockholder’s ability to bring a claim in a judicial forum that it finds favorable for disputes with us or our Directors or employees, which may discourage such lawsuits against us and our Directors and employees.
We may not pay dividends on our common stock, and the terms our indebtedness could limit our ability to pay dividends on our common stock.
Any decision to declare and pay dividends will be made at the sole discretion of our Board of Directors and will depend on, among other things, our results of operations, cash requirements, financial condition, contractual restrictions under our indebtedness and other factors that our Board of Directors may deem relevant. There can be no assurance that a payment of a dividend will occur in the future.
Item 1B. Unresolved Staff Comments.
None.
Item 2. Properties.
Our corporate headquarters is located in a leased office at 22 Sylvan Way, Parsippany, New Jersey, with the lease expiring in 2029. We also lease space for our reservation center and data warehouse in Saint John, New Brunswick, Canada pursuant to a lease that expires in 2020. In addition, we have an additional 14 leases for office space in 11 countries outside the United States and an additional three leases within the United States with expiration dates ranging between 2019 and 2022. We will evaluate the need to renew each lease on a case-by-case basis prior to its expiration.
Our owned hotel portfolio, which is part of our Hotel Management segment, currently consists of (i) the Wyndham Grand Rio Mar Beach Resort and Spa in Puerto Rico, located at Rio Mar Boulevard, Rio Grande, Puerto Rico, and (ii) the Wyndham Grand Orlando Bonnet Creek, located at Chelonia Parkway, Orlando, Florida. Aside from these hotels, we do not own any of the nearly 9,200 properties within our franchised and managed portfolio.
Item 3. Legal Proceedings.
We are involved in various claims and lawsuits arising in the ordinary course of business, none of which, in the opinion of management, is expected to have a material adverse effect on our results of operations or financial condition. See Note 13 - Commitments and Contingencies to the Consolidated and Combined Financial Statements for a description of claims and legal actions arising in the ordinary course of our business.
Item 4. Mine Safety Disclosures.
Not applicable.
PART II
Item 5. Market for Registrant’s Common Equity, Related Stockholder Matters and Issuer Purchases of Equity Securities.
Market Price of Common Stock
Our common stock is listed on the New York Stock Exchange (“NYSE”) under the symbol “WH”. As of January 31, 2019, the number of stockholders of record was 4,954.
Dividend Policy
Starting in the second quarter of 2018, we declared a quarterly dividend of $0.25 per share of common stock issued and outstanding on the record date for the applicable dividend ($75 million in aggregate for the year). The declaration and payment of future dividends to holders of our common stock are at the discretion of our Board and depend upon many factors, including our financial condition, earnings, capital requirements of our business, covenants associated with certain debt obligations, legal requirements, regulatory constraints, industry practice and other factors that our Board deems relevant. There can be no assurance that a payment of a dividend will occur in the future.
Issuer Purchases of Equity Securities
On May 9, 2018, our Board of Directors authorized a stock repurchase program that enables us to repurchase up to $300 million of our common stock. Below is a summary of our common stock repurchases by month for the quarter ended December 31, 2018:
|
| | | | | | | | | | | | | |
Period | Total Number of Shares Purchased | | Average Price Paid per Share | | Total Number of Shares Purchased as Part of Publicly Announced Plan | | Approximate Dollar Value of Shares that May Yet Be Purchased Under Plan |
October 2018 | 308,921 |
| | $ | 49.95 |
| | 308,921 |
| | $ | 225,374,504 |
|
November 2018 | 435,811 |
| | 48.18 |
| | 435,811 |
| | 204,375,095 |
|
December 2018 (a) | 500,965 |
| | 46.96 |
| | 500,965 |
| | 180,851,596 |
|
Total | 1,245,697 |
| | $ | 48.13 |
| | 1,245,697 |
| | $ | 180,851,596 |
|
__________________________
(a) Includes 56,246 shares purchased for which the trade date occurred during December 2018 while settlement occurred during January 2019.
Stock Performance Graph
The following graph compares the cumulative total stockholder return of our common stock against the S&P 500 Index and the S&P Hotels, Resorts & Cruise Lines Index (consisting of Carnival Corporation, Marriott International Inc., Norwegian Cruise Line Holdings Ltd., Royal Caribbean Cruises Ltd. and Hilton Worldwide Holdings Inc.) for the period from June 1, 2018 to December 31, 2018. The graph assumes that $100 was invested on June 1, 2018 (the first day of regular-way trading) and all dividends and other distributions were reinvested. The Stock Performance Graph is not deemed filed with the SEC and shall not be deemed incorporated by reference into any of our prior or future filings made with the SEC.
Cumulative Total Return
|
| | | | | |
| June 1, 2018 | | December 31, 2018 |
Wyndham Hotels & Resorts, Inc. | 100.00 |
| | 74.91 |
|
S&P 500 | 100.00 |
| | 93.72 |
|
S&P Hotels, Resorts & Cruise Lines | 100.00 |
| | 84.58 |
|
Item 6. Selected Financial Data.
The following selected historical consolidated and combined statement of income data for the years ended December 31, 2018, 2017 and 2016 and the selected historical consolidated and combined balance sheet data as of December 31, 2018 and 2017 are derived from the audited Consolidated and Combined Financial Statements of Wyndham Hotels & Resorts included elsewhere in this report. The selected historical combined statement of income data for the years ended December 31, 2015 and 2014 and the selected historical combined balance sheet data as of December 31, 2016, 2015 and 2014 are derived from unaudited combined financial statements of Wyndham Hotels & Resorts businesses that are not included in this report. We have prepared our unaudited combined financial statements on the same basis as our audited Consolidated and Combined Financial Statements and, in our opinion, have included all adjustments, which include only normal recurring adjustments, necessary to present fairly in all material respects our financial position and results of operations.
The selected historical combined financial data below should be read together with the audited Consolidated and Combined Financial Statements of the Wyndham Hotels & Resorts, including the notes thereto and the other financial information included elsewhere in this report.
|
| | | | | | | | | | | | | | | | | | | | |
| | As of or For the Year Ended December 31, |
($ in millions, except per share amounts and RevPAR) | | 2018 | | 2017 | | 2016 | | 2015 (a) | | 2014 (a) |
Statement of Income Data: | | | | | | | | | | | | | | | |
Net revenues | | $ | 1,868 |
| | $ | 1,280 |
| | $ | 1,269 |
| | $ | 1,301 |
| | $ | 1,103 |
|
Total expenses | | | 1,585 |
| | | 1,031 |
| | | 974 |
| | | 1,051 |
| | | 867 |
|
Operating income | | | 283 |
| | | 249 |
| | | 295 |
| | | 250 |
| | | 236 |
|
Interest expense, net | | | 60 |
| | | 6 |
| | | 1 |
| | | 1 |
| | | (1 | ) |
Income before income taxes | | | 223 |
| | | 243 |
| | | 294 |
| | | 249 |
| | | 237 |
|
Provision for income taxes | | | 61 |
| | | 13 |
| | | 118 |
| | | 100 |
| | | 85 |
|
Net income | | | 162 |
| | | 230 |
| | | 176 |
| | | 149 |
| | | 152 |
|
Per Share Data: | | | | | | | | | | | | | | | |
Diluted earnings per share | | $ | 1.62 |
| | $ | 2.31 |
| | $ | 1.76 |
| | $ | 1.49 |
| | $ | 1.52 |
|
Cash dividends declared per share | | | 0.75 |
| | | — |
| | | — |
| | | — |
| | | — |
|
| | | | | | | | | | | | | | | |
Balance Sheet Data: | | | | | | | | | | | | | | | |
Cash | | $ | 366 |
| | $ | 57 |
| | $ | 28 |
| | $ | 38 |
| | $ | 25 |
|
Total assets (b) | | | 4,976 |
| | | 2,137 |
| | | 1,998 |
| | | 1,959 |
| | | 1,891 |
|
Total debt (b) | | | 2,141 |
| | | 184 |
| | | 174 |
| | | 95 |
| | | 105 |
|
Total liabilities (b) | | | 3,558 |
| | | 875 |
| | | 913 |
| | | 780 |
| | | 702 |
|
Total stockholders’ / invested equity (c) | | | 1,418 |
| | | 1,262 |
| | | 1,086 |
| | | 1,179 |
| | | 1,189 |
|
| | | | | | | | | | | | | | | |
Other Financial Data | | | | | | | | | | | | | | | |
Royalties and franchise fees | | $ | 441 |
| | $ | 364 |
| | $ | 354 |
| | $ | 347 |
| | $ | 332 |
|
License and other fees | | | 111 |
| | | 75 |
| | | 65 |
| | | 64 |
| | | 47 |
|
Adjusted EBITDA (d) | | | | | | | | | | | | | | | |
Hotel Franchising segment | | $ | 515 |
| | $ | 402 |
| | $ | 400 |
| | $ | 366 |
| | $ | 340 |
|
Hotel Management segment | | | 47 |
| | | 21 |
| | | 26 |
| | | 28 |
| | | 13 |
|
Corporate and other (e) | | | (55 | ) | | | (40 | ) | | | (38 | ) | | | (41 | ) | | | (39 | ) |
Total Adjusted EBITDA (f) | | $ | 507 |
| | $ | 383 |
| | $ | 388 |
| | $ | 353 |
| | $ | 314 |
|
| | | | | | | | | | | | | | | |
Operating Statistics: | | | | | | | | | | | | | | | |
Total Company | | | | | | | | | | | | | | | |
Number of properties (g) | | | 9,157 |
| | | 8,422 |
| | | 8,035 |
| | | 7,812 |
| | | 7,645 |
|
Number of rooms (h) | | | 809,900 |
| | | 728,200 |
| | | 697,600 |
| | | 678,000 |
| | | 660,800 |
|
RevPAR (i) | | $ | 40.80 |
| | $ | 37.63 |
| | $ | 36.67 |
| | $ | 37.26 |
| | $ | 37.57 |
|
Average royalty rate (j) | | | 3.78 | % | | | 3.66 | % | | | 3.65 | % | | | 3.68 | % | | | 3.64 | % |
United States | | | | | | | | | | | | | | | |
Number of properties (g) | | | 6,358 |
| | | 5,726 |
| | | 5,525 |
| | | 5,582 |
| | | 5,646 |
|
Number of rooms (h) | | | 506,100 |
| | | 440,100 |
| | | 429,000 |
| | | 435,300 |
| | | 440,200 |
|
RevPAR (i) | | $ | 45.30 |
| | $ | 41.04 |
| | $ | 39.77 |
| | $ | 39.13 |
| | $ | 37.27 |
|
Average royalty rate (j) | | | 4.53 | % | | | 4.45 | % | | | 4.35 | % | | | 4.37 | % | | | 4.31 | % |
______________________
| |
(a) | As described in Note 2 - Summary of Significant Accounting Polices to the Consolidated and Combined Financial Statements contained in Part II, Item 8 of this report, we adopted the new accounting standard related to revenue recognition utilizing the full retrospective transition method on January 1, 2018. However, amounts have not been restated for the years 2015 and 2014 for this standard. |
| |
(b) | Reflects the impact of the adoption of the new accounting standards related to the balance sheet classification of deferred taxes and the presentation of debt issuance costs during 2016. |
| |
(c) | Represents Wyndham Hotels & Resorts stand-alone stockholders’ equity since May 31, 2018 and Wyndham Worldwide net investment (capital contributions and earnings from operations less dividends) in Wyndham Hotels & Resorts and accumulated other comprehensive income for 2014 through May 31, 2018, the date of our spin-off. |
| |
(d) | “Adjusted EBITDA” is defined as net income excluding interest expense, depreciation and amortization, impairment charges, restructuring and related charges, contract termination costs, transaction-related expenses (acquisition-, disposition- or separation-related), foreign currency impacts of highly inflationary countries, stock-based compensation expense, early extinguishment of debt costs and income taxes. Beginning with the third quarter of 2018, Wyndham Hotels’ calculation of Adjusted EBITDA excludes the currency effects of highly inflationary countries. Wyndham Hotels believes that Adjusted EBITDA is a useful measure of performance for its segments which, when considered with U.S. Generally Accepted Accounting Principles (“GAAP”) measures, allows a more complete understanding of its operating performance. Wyndham Hotels’ presentation of Adjusted EBITDA may not be comparable to similarly-titled measures used by other companies. |
| |
(e) | Corporate and other reflects unallocated corporate costs that are not attributable to an operating segment. |
| |
(f) | The reconciliation of Net Income to Adjusted EBITDA is as follows: |
|
| | | | | | | | | | | | | | | | | | | |
| Year Ended December 31, |
(in millions) | 2018 | | 2017 | | 2016 | | 2015 | | 2014 |
Net income | $ | 162 |
| | $ | 230 |
| | $ | 176 |
| | $ | 149 |
| | $ | 152 |
|
Provision for income taxes | 61 |
| | 13 |
| | 118 |
| | 100 |
| | 85 |
|
Depreciation and amortization | 99 |
| | 75 |
| | 73 |
| | 67 |
| | 60 |
|
Interest expense, net | 60 |
| | 6 |
| | 1 |
| | 1 |
| | (1 | ) |
Stock-based compensation | 9 |
| | 11 |
| | 10 |
| | 9 |
| | 9 |
|
Separation-related expenses | 77 |
| | 3 |
| | — |
| | — |
| | — |
|
Transaction-related expenses, net | 36 |
| | 3 |
| | 1 |
| | 3 |
| | — |
|
Foreign currency impact of highly inflationary countries | 3 |
| | — |
| | — |
| | — |
| | — |
|
Impairment expense | — |
| | 41 |
| | — |
| | 7 |
| | 8 |
|
Restructuring costs | — |
| | 1 |
| | 2 |
| | 3 |
| | 1 |
|
Contract termination costs | — |
| | — |
| | 7 |
| | 14 |
| | — |
|
Adjusted EBITDA | $ | 507 |
| | $ | 383 |
| | $ | 388 |
| | $ | 353 |
| | $ | 314 |
|
| |
(g) | Represents the number of hotels at the end of the period. |
| |
(h) | Represents the number of rooms in hotel properties at the end of the period that are under franchise and/or management agreements, or are Company-owned. |
| |
(i) | Represents revenue per available room and is calculated by multiplying the average occupancy rate by the average daily rate. |
| |
(j) | Represents royalties divided by the gross room revenues of our franchisees. |
In presenting the financial data above in conformity with U.S. GAAP, we are required to make estimates and assumptions that affect the amounts reported. See “Management’s Discussion and Analysis of Financial Condition and Results of Operations–Financial Condition, Liquidity and Capital Resources–Critical Accounting Policies,” for a detailed discussion of the accounting policies that we believe require subjective and complex judgments that could potentially affect reported results.
Acquisitions
Between January 1, 2014 and December 31, 2018, we completed the following acquisitions:
| |
• | In May 2018, we acquired La Quinta Holdings Inc.’s hotel franchising and hotel management business (“La Quinta”) and its portfolio of over 900 hotels; |
| |
• | In October 2017, we acquired the AmericInn hotel brand and its portfolio of approximately 200 franchised hotels in the United States; |
| |
• | In November 2016, we acquired Fen Hotels, adding the Dazzler and Esplendor Boutique brands to our portfolio, as well as a Latin America-based hotel management company; and |
| |
• | In January 2015, we acquired Dolce Hotels and Resorts, a franchisor and manager of properties focused on group accommodations in Europe and North America. |
The results of operations and financial position of these acquisitions have been included beginning from the respective acquisition dates. See Note 5 - Acquisitions to our audited Consolidated and Combined Financial Statements included herein for a discussion of acquisitions completed during 2018, 2017 and 2016.
Separation-Related and Transaction-Related Costs, Impairment, Restructuring and Other Charges
During 2018, we incurred $77 million of separation-related costs associated with our spin-off from Wyndham Worldwide. These costs primarily consist of severance, stock-based compensation and other employee-related costs. Additionally, during 2018, we incurred $36 million of transaction-related costs consisting of $59 million primarily related to our acquisition of La Quinta partially offset by a $23 million gain on the sale of its Knights Inn brand in May 2018. This sale was not material to our results of operations or financial position.
During 2017, we recorded $1 million of charges related to restructuring initiatives, primarily focused on realigning our brand operations. Additionally, in 2017, we recorded $41 million of non-cash impairment charges, of which $25 million was for a write-down of a guarantee asset and a development advance note receivable related to a hotel management agreement and $16 million was primarily related to a partial write-down of management agreement assets.
During 2016, we recorded $2 million of charges related to restructuring initiatives, which were primarily focused on enhancing organizational efficiency. Additionally, in 2016, we recorded a $7 million charge related to the termination of a management contract.
During 2015, we recorded $3 million of restructuring costs resulting from a realignment of brand services and call center operations. Additionally, in 2015, we recorded a $7 million non-cash impairment charge related to the write-down of terminated in-process technology projects resulting from our decision to outsource our reservation system to a third-party partner and a $14 million charge associated with the anticipated termination of a management contract within our hotel management business.
During 2014, we recorded $6 million of restructuring and related costs associated with the departure of an executive, as well as initiatives targeted at improving the alignment of the organizational structure of our business with our strategic objectives. In addition, we reversed $1 million of previously recorded contract termination costs related to our 2013 organizational realignment initiative. Additionally, in 2014 we recorded an $8 million non-cash impairment charge related to the write-down of an investment in a joint venture.
Item 7. Management’s Discussion and Analysis of Financial Condition and Results of Operations.
(Unless otherwise noted, all amounts are in millions, except share and per share amounts)
References herein to “Wyndham Hotels,” the “Company,” “we,” “our” and “us” refer to both (i) Wyndham Hotels & Resorts, Inc. and its consolidated subsidiaries for time periods following the consummation of the spin-off and (ii) the Wyndham Hotels & Resorts businesses for time periods prior to the consummation of our spin-off from Wyndham Worldwide. Unless the context otherwise suggests, references herein to “Wyndham Worldwide,” “Wyndham Destinations” and “former Parent” refer to Wyndham Worldwide Corporation and its consolidated subsidiaries.
BUSINESS AND OVERVIEW
Wyndham Hotels & Resorts is a leading global hotel franchisor, licensing its renowned hotel brands to hotel owners in more than 80 countries around the world.
Wyndham Hotels operates in the following segments:
| |
• | Hotel franchising — licenses our lodging brands and provides related services to third-party hotel owners and others. |
| |
• | Hotel management — provides hotel management services for full-service and limited-service hotels as well as two hotels that are owned by Wyndham Hotels. |
The Consolidated and Combined Financial Statements presented herein have been prepared on a stand-alone basis and prior to May 31, 2018 are derived from the consolidated financial statements and accounting records of Wyndham Worldwide. The Consolidated and Combined Financial Statements include Wyndham Hotels’ assets, liabilities, revenues, expenses and cash flows and all entities in which Wyndham Hotels has a controlling financial interest.
RESULTS OF OPERATIONS
Discussed below are our key operating statistics, combined results of operations and the results of operations for each of our reportable segments. The reportable segments presented below represent our operating segments for which discrete financial information is available and used on a regular basis by our chief operating decision maker to assess performance and to allocate resources. In identifying our reportable segments, we also consider the nature of services provided by our operating segments. Management evaluates the operating results of each of our reportable segments based upon net revenues and Adjusted EBITDA. Beginning with the third quarter of 2018, our calculation of Adjusted EBITDA excludes the currency effects of highly inflationary countries. Adjusted EBITDA is defined as net income excluding interest expense, depreciation and amortization, impairment charges, restructuring and related charges, contract termination costs, transaction-related expenses (acquisition-, disposition- or separation-related), foreign currency impacts of highly inflationary countries, stock-based compensation expense, early extinguishment of debt costs and income taxes. We believe that Adjusted EBITDA is a useful measure of performance for our segments and, when considered with U.S. GAAP measures, gives a more complete understanding of our operating performance. Adjusted EBITDA is not a recognized term under U.S. GAAP and should not be considered as an alternative to net income or other measures of financial performance or liquidity derived in accordance with U.S. GAAP. Our presentation of Adjusted EBITDA may not be comparable to similarly-titled measures used by other companies.
We generate royalties and franchise fees, management fees and other revenues from hotel franchising and hotel management activities, as well as fees from licensing our “Wyndham” trademark, certain other trademarks and intellectual property. In addition, pursuant to our franchise and management contracts with third-party hotel owners, we generate marketing, reservation and loyalty fee revenues and cost reimbursement revenues that over time are offset, respectively, by the marketing, reservation and loyalty costs and property operating costs that we incur.
OPERATING STATISTICS - 2018 VS. 2017
The table below presents our operating statistics for the years ended December 31, 2018 and 2017. “Rooms” represent the number of hotel rooms in our brand systems as of the last date of the period. “RevPAR” represents the room rental revenues generated by our franchisees divided by the number of available room-nights in the period. These operating statistics are drivers of our revenues and therefore provide an enhanced understanding of our business. Refer to the section below for a discussion as to how these operating statistics affected our business for the periods presented.
|
| | | | | | | | | | |
| Year Ended December 31, |
| 2018 | | 2017 | | % Change |
Rooms(a) | | | | | |
United States | 506,100 |
| | 440,100 |
| | 15 | % |
International | 303,800 |
| | 288,100 |
| | 5 | % |
Total rooms | 809,900 |
|
| 728,200 |
| | 11 | % |
RevPAR(a) | | | | | |
United States | $ | 45.30 |
| | $ | 41.04 |
| | 10 | % |
International(b) | 33.31 |
| | 32.27 |
| | 3 | % |
Total RevPAR(b) | 40.80 |
| | 37.63 |
| | 8 | % |
______________________
| |
(a) | Includes the impact of acquisitions and dispositions from their respective dates forward. |
| |
(b) | Excluding currency effects for the year ended December 31, 2018, international RevPAR increased 4% and total RevPAR increased 9%. |
YEAR ENDED DECEMBER 31, 2018 VS. YEAR ENDED DECEMBER 31, 2017
|
| | | | | | | | | | |
| Year Ended December 31, |
| 2018 | | 2017 | | % Change |
Net revenues | $ | 1,868 |
| | $ | 1,280 |
| | 46 | % |
Expenses | 1,585 |
| | 1,031 |
| | 54 | % |
Operating income | 283 |
| | 249 |
| | 14 | % |
Interest expense, net | 60 |
| | 6 |
| | NM |
|
Income before income taxes | 223 |
| | 243 |
| | (8 | %) |
Provision for income taxes | 61 |
| | 13 |
| | 369 | % |
Net income | $ | 162 |
| | $ | 230 |
| | (30 | %) |
During 2018, net revenues increased 46% compared with the prior-year, which was driven by $513 million of incremental revenues from the La Quinta acquisition, which included $324 million of cost reimbursement revenues. Excluding the La Quinta acquisition, net revenues increased 6% primarily due to higher license and other fees and higher royalties.
During 2018, total expenses increased 54%, which included $443 million of incremental expenses associated with the La Quinta acquisition, $77 million of separation-related costs and $36 million of net transaction-related costs that were primarily associated with the La Quinta acquisition. During 2018:
| |
• | Marketing, reservation and loyalty expenses decreased to 26.0% of revenues from 29.1% during 2017, primarily due to higher cost reimbursement revenues. Excluding La Quinta, marketing, reservation and loyalty expenses increased to 29.9% of revenues from 29.1% primarily due to higher marketing, reservation and loyalty expenses resulting from the increase in marketing and reservation fee revenues from franchisees; |
| |
• | Operating expenses decreased to 9.7% of revenues from 14.3% during 2017, primarily as a result of the increase in cost reimbursement revenues and reduced expenses at our owned hotel in Puerto Rico resulting from insurance recoveries received in 2018 related to hurricanes that occurred in 2017; and |
| |
• | General and administrative expenses decreased to 6.4% of revenues from 6.9% during 2017, primarily due to higher cost reimbursement revenues, partially offset by higher employee-related and information technology costs, principally related to operating as a stand-alone public company. |
Marketing, reservation and loyalty revenues exceeded marketing, reservation and loyalty expenses by $5 million. Excluding La Quinta, marketing, reservation and loyalty expenses exceeded marketing, reservation and loyalty revenues by $9 million. Marketing, reservation and loyalty expenses exceeded marketing, reservation and loyalty revenues by $2 million during 2017.
During 2018, net interest expense increased $54 million primarily due to the borrowings used to fund the La Quinta acquisition.
Our effective tax rates were 27.4% and 5.3% for 2018 and 2017, respectively. The increase was principally due to the net tax benefit of $85 million recorded from the enactment of the U.S. Tax Cuts and Jobs Act in 2017.
As a result of these items, principally driven by the net income tax benefit in 2017, separation-related and transaction-related expenses in 2018 and higher interest expense in 2018, net income decreased $68 million compared with 2017.
Reconciliation of Net Income to Adjusted EBITDA
|
| | | | | | | |
| Year Ended December 31, |
| 2018 | | 2017 |
Net income | $ | 162 |
| | $ | 230 |
|
Provision for income taxes | 61 |
| | 13 |
|
Depreciation and amortization | 99 |
| | 75 |
|
Interest expense, net | 60 |
| | 6 |
|
Stock-based compensation | 9 |
| | 11 |
|
Separation-related expenses | 77 |
| | 3 |
|
Transaction-related expenses, net | 36 |
| | 3 |
|
Foreign currency impact of highly inflationary countries | 3 |
| | — |
|
Impairment expense | — |
| | 41 |
|
Restructuring costs | — |
| | 1 |
|
Adjusted EBITDA | $ | 507 |
| | $ | 383 |
|
For 2018, we reported net income of $162 million, which included after-tax charges of $58 million related to our separation from Wyndham Destinations, $29 million for net transaction-related costs primarily related to acquisitions and dispositions and $3 million related to the foreign currency impact of the highly inflationary economy in Argentina. For 2017, we reported net income of $230 million, which included after-tax charges of $25 million for impairments, $4 million for separation- and transaction-related costs and $1 million for restructuring activities.
Following is a discussion of the results of each of our segments and Corporate and Other for 2018 compared to 2017:
|
| | | | | | | | | | | | | | | | | | | | | |
| Net Revenues | | Adjusted EBITDA |
| 2018 | | 2017 | | % Change | | 2018 | | 2017 | | % Change |
Hotel Franchising | $ | 1,135 |
| | $ | 897 |
| | 27 | % | | $ | 515 |
| | $ | 402 |
| | 28 | % |
Hotel Management | 726 |
| | 383 |
| | 90 | % | | 47 |
| | 21 |
| | 124 | % |
Corporate and Other | 7 |
| | — |
| | NM |
| | (55 | ) | | (40 | ) | | NM |
|
Total Company | $ | 1,868 |
| | $ | 1,280 |
| | 46 | % | | $ | 507 |
| | $ | 383 |
| | 32 | % |
Hotel Franchising |
| | | | | | | | | | |
| Year Ended December 31, |
| 2018 | | 2017 | | % Change |
Rooms(a) | | | | | |
United States | 453,900 |
| | 427,500 |
| | 6 | % |
International | 288,900 |
| | 275,400 |
| | 5 | % |
Total rooms | 742,800 |
| | 702,900 |
| | 6 | % |
RevPAR(a) | | | | | |
United States | $ | 43.04 |
| | $ | 39.35 |
| | 9 | % |
International(b) | 32.09 |
| | 31.14 |
| | 3 | % |
Total RevPAR(b) | 38.86 |
| | 36.18 |
| | 7 | % |
______________________
| |
(a) | Includes the impact of acquisitions and dispositions from the acquisition and disposition dates forward. |
| |
(b) | Excluding currency effects, international RevPAR increased 4% and total RevPAR increased 8%. |
Net revenues increased 27% during 2018 primarily due to the acquisition of La Quinta, which contributed to 6% total hotel franchising system growth and 7% higher RevPAR. Excluding the La Quinta acquisition, net revenues increased 8% primarily due to higher license fees, an increase in marketing, reservation and loyalty fees and higher royalties and franchise fees.
Adjusted EBITDA increased 28% during 2018 primarily due to higher revenues. Excluding the La Quinta acquisition, Adjusted EBITDA increased 9% primarily due to higher revenues. During 2018:
| |
• | Marketing, reservation and loyalty expenses increased to 41.2% of revenues from 40.6% during the prior year primarily due to the La Quinta acquisition; |
| |
• | Operating expenses decreased to 9.6% of revenue compared to 10.4% during the prior year primarily due to the La Quinta acquisition; and |
| |
• | General and administrative expenses decreased to 3.8% of revenues from 4.2% during the prior year, primarily due to lower employee-related expenses coupled with higher net revenues. |
Marketing, reservation and loyalty revenues exceeded marketing, reservation and loyalty expenses by $21 million and $6 million during 2018 and 2017, respectively. Excluding La Quinta, marketing, reservation and loyalty expenses exceeded marketing, reservation and loyalty revenues by $1 million during 2018.
Hotel Management
|
| | | | | | | | | | |
| Year Ended December 31,
|
| 2018 | | 2017 | | % Change |
Rooms(a) | | | | | |
United States | 52,200 |
| | 12,600 |
| | 314 | % |
International | 14,900 |
| | 12,700 |
| | 17 | % |
Total rooms | 67,100 |
| | 25,300 |
| | 165 | % |
RevPAR(a) | | | | | |
United States | $ | 72.76 |
| | $ | 97.08 |
| | (25 | %) |
International(b) | 57.84 |
| | 58.18 |
| | (1 | %) |
Total RevPAR(b) | 68.72 |
| | 78.59 |
| | (13 | %) |
______________________
| |
(a) | Includes the impact of acquisitions and disposition from their respective dates forward. |
| |
(b) | Excluding currency effects, International RevPAR increased 5% and total RevPAR decreased 11%. |
Net revenues increased 90% during 2018 primarily due to $351 million of incremental revenues from the La Quinta acquisition (including $324 million of cost reimbursement revenues). Excluding La Quinta, net revenues decreased 2% due primarily to certain management contracts being transferred to our former Parent upon our spin-off.
Adjusted EBITDA increased 124% in 2018 including approximately $14 million of Adjusted EBITDA from La Quinta. Excluding La Quinta, Adjusted EBITDA increased 57% due to reduced expenses at our owned hotel in Puerto Rico due to insurance recoveries in 2018 related to hurricanes that occurred in 2017.
Cost reimbursement revenue was equal to reimbursable expenses in both 2018 and 2017. Marketing, reservation and loyalty expenses exceeded marketing, reservation and loyalty revenues by $16 million ($9 million excluding La Quinta) in 2018 and by $7 million in 2017.
Corporate and Other
Revenues increased $7 million during 2018, which represents fees earned under a transition services agreement with our former Parent.
Adjusted EBITDA decreased $15 million during 2018 compared to the prior year, primarily due to an increase in general overhead expenses in connection with operating as a stand-alone public company, partially offset by higher revenues.
OPERATING STATISTICS - 2017 VS. 2016
The table below presents our operating statistics for the years ended December 31, 2017 and 2016. “Rooms” represent the number of hotel rooms in our brand systems as of the last date of the period. “RevPAR” represents the room rental revenues generated by our franchisees divided by the number of available room-nights in the period. These operating statistics are drivers of our revenues and therefore provide an enhanced understanding of our business. Refer to the section below for a discussion as to how these operating statistics affected our business for the periods presented.
|
| | | | | | | | | | |
| Year Ended December 31,
|
| 2017 | | 2016 | | % Change |
Rooms(a) | | | | | |
United States | 440,100 |
| | 429,000 |
| | 3 | % |
International | 288,100 |
| | 268,600 |
| | 7 | % |
Total rooms | 728,200 |
|
| 697,600 |
| | 4 | % |
RevPAR(a) | | | | | |
United States | $ | 41.04 |
| | $ | 39.77 |
| | 3 | % |
International(b) | 32.27 |
| | 31.32 |
| | 3 | % |
Total RevPAR(b) | 37.63 |
| | 36.67 |
| | 3 | % |
______________________
| |
(a) | Includes the impact of acquisitions from their respective dates forward. |
| |
(b) | Excluding currency effects for the year ended December 31, 2017, international and total RevPAR increased 3%. |
YEAR ENDED DECEMBER 31, 2017 VS. YEAR ENDED DECEMBER 31, 2016
|
| | | | | | | | | | |
| Year Ended December 31, |
| 2017 | | 2016 | | % Change |
Net revenues | $ | 1,280 |
| | $ | 1,269 |
| | 1 | % |
Expenses | 1,031 |
| | 974 |
| | 6 | % |
Operating income | 249 |
| | 295 |
| | (16 | %) |
Interest expense, net | 6 |
| | 1 |
| | NM |
|
Income before income taxes | 243 |
| | 294 |
| | (17 | %) |
Provision for income taxes | 13 |
| | 118 |
| | (89 | %) |
Net income | $ | 230 |
| | $ | 176 |
| | 31 | % |
During 2017, net revenues increased 1% compared with the prior-year, primarily due to higher royalties and franchise fees from global system growth, higher RevPAR and an increase in license and other fees, partially offset by lower cost reimbursements revenues.
During 2017, total expenses increased 6% and include $41 million of non-cash impairment charges. During 2017:
| |
• | Marketing, reservation and loyalty expenses decreased to 29.1% of revenues from 29.6% during 2016, due to an overall increase in net revenues; |
| |
• | Operating expenses increased to 14.3% of revenues from 13.2% during 2016, primarily as a result of higher employee-related costs and higher expenses at our owned hotel in Puerto Rico due to the impact of the hurricanes during 2017; and |
| |
• | General and administrative expenses increased to 6.9% of revenues from 6.5% during 2016, primarily due to higher employee-related and legal costs. |
Marketing, reservation and loyalty expenses exceeded marketing, reservation and loyalty revenue by $2 million and $1 million during 2017 and 2016, respectively.
Our effective tax rate was 5.3% for 2017, primarily due to an $85 million net tax benefit from the impact of the enactment of the U.S. Tax Cuts and Jobs Act during the year. Our effective tax rate was 40.1% in 2016.
As a result of the foregoing, net income increased by $54 million, or 31%, from 2016.
Reconciliation of Net Income to Adjusted EBITDA
|
| | | | | | | |
| Year Ended December 31, |
| 2017 | | 2016 |
Net income | $ | 230 |
| | $ | 176 |
|
Provision for income taxes | 13 |
| | 118 |
|
Depreciation and amortization | 75 |
| | 73 |
|
Interest expense, net | 6 |
| | 1 |
|
Stock-based compensation | 11 |
| | 10 |
|
Separation-related expenses | 3 |
| | — |
|
Transaction-related expenses, net | 3 |
| | 1 |
|
Impairments | 41 |
| | — |
|
Restructuring costs | 1 |
| | 2 |
|
Contract termination costs | — |
| | 7 |
|
Adjusted EBITDA | $ | 383 |
| | $ | 388 |
|
For 2017, we reported net income of $230 million, which included after-tax charges of (i) $25 million for impairments, (ii) $2 million for transaction-related costs for acquisitions, (iii) $2 million related to our planned separation from Wyndham Worldwide and (iv) $1 million for restructuring activities. In 2016, we reported net income of $176 million, which included after-tax charges of (i) $5 million for termination of a management contract, (ii) $1 million for transaction-related costs and (iii) $1 million for restructuring activities.
Following is a discussion of the results of each of our segments and Corporate and Other for 2017 compared to 2016:
|
| | | | | | | | | | | | | | | | | | | | | |
| Net Revenues | | Adjusted EBITDA |
| 2017 | | 2016 | | % Change | | 2017 | | 2016 | | % Change |
Hotel Franchising | $ | 897 |
| | $ | 881 |
| | 2 | % | | $ | 402 |
| | $ | 400 |
| | 1 | % |
Hotel Management | 383 |
| | 388 |
| | (1 | %) | | 21 |
| | 26 |
| | (19 | %) |
Corporate and Other | — |
| | — |
| | — |
| | (40 | ) | | (38 | ) | | 5 | % |
Total Company | $ | 1,280 |
| | $ | 1,269 |
| | 1 | % | | $ | 383 |
| | $ | 388 |
| | (1 | %) |
Hotel Franchising
|
| | | | | | | | | | |
| Year Ended December 31,
|
| 2017 | | 2016 | | % Change |
Rooms(a) | | | | | |
United States | 427,500 |
| | 415,900 |
| | 3 | % |
International | 275,400 |
| | 258,200 |
| | 7 | % |
Total rooms | 702,900 |
| | 674,100 |
| | 4 | % |
RevPAR(a) | | | | | |
United States | $ | 39.35 |
| | $ | 38.05 |
| | 3 | % |
International(b) | 31.14 |
| | 30.30 |
| | 3 | % |
Total RevPAR(b) | 36.18 |
| | 35.21 |
| | 3 | % |
______________________
| |
(a) | Includes the impact of acquisitions from their respective dates forward. |
| |
(b) | Excluding currency effects, international and total RevPAR increased 3%. |
Net revenues increased 2% during 2017 compared with 2016 primarily due to 4% total hotel franchising system growth and 3% higher RevPAR.
Adjusted EBITDA increased 1% during 2017 primarily due to higher revenues. Foreign currency translation unfavorably impacted Adjusted EBITDA by $1 million. During 2017:
| |
• | Marketing, reservation and loyalty expenses decreased to 40.6% of revenues from 41.9% during 2016 due primarily to an increase in total net revenues; |
| |
• | Operating expenses increased to 10.4% of revenue from 8.8% during 2016 due to higher employee-related costs; and |
| |
• | General and administrative expenses increased to 4.2% of revenues from 3.9% during 2016 primarily due to higher legal costs. |
Marketing, reservation and loyalty revenues exceeded marketing, reservation and loyalty expenses by $6 million and $4 million in 2017 and 2016, respectively.
Hotel Management
|
| | | | | | | | | | |
| Year Ended December 31,
|
| 2017 | | 2016 | | % Change |
Rooms(a) | | | | | |
United States | 12,600 |
| | 13,100 |
| | (4 | %) |
International | 12,700 |
| | 10,400 |
| | 22 | % |
Total rooms | 25,300 |
| | 23,500 |
| | 8 | % |
RevPAR(a) | | | | | |
United States | $ | 97.08 |
| | $ | 95.73 |
| | 1 | % |
International(b) | 58.18 | | 62.88 | | (7 | %) |
Total RevPAR(b) | 78.59 | | 83.31 | | (6 | %) |
______________________
| |
(a) | Includes the impact of acquisitions from their respective dates forward. |
| |
(b) | Excluding currency effects, international RevPAR decreased 6% and total RevPAR decreased 5%. |
Net revenues declined $5 million during 2017 compared with 2016, primarily as a result of a $7 million reduction in cost reimbursement revenues.
Adjusted EBITDA decreased by $5 million during 2017 compared with 2016 as a result of the unfavorable impact the 2017 hurricanes had on our owned hotel in Puerto Rico. During 2017:
| |
• | Cost reimbursements decreased to 68.9% of revenues from 69.8% during 2016; |
| |
• | Operating expenses increased to 22.7% of revenues from 20.6% in 2016, primarily as a result of higher operating expenses at our owned hotel in Puerto Rico due to the impact of the hurricanes during 2017 and higher expenses associated with hotel management guarantees; |
| |
• | Marketing, reservation and loyalty expenses increased to 2.3% of revenues from 1.9% during 2016; and |
| |
• | General and administrative expenses decreased to 0.7% of revenues from 0.9% during 2016. |
Cost reimbursement revenue was equal to reimbursable expenses in both 2017 and 2016. Marketing, reservation and loyalty expenses exceeded marketing, reservation and loyalty revenues by $7 million and $5 million in 2017 and 2016, respectively.
Corporate and Other
Corporate expenses increased $2 million during 2017 compared to 2016.
FINANCIAL CONDITION, LIQUIDITY AND CAPITAL RESOURCES
FINANCIAL CONDITION
|
| | | | | | | | | | | |
| December 31,
2018 | | December 31,
2017 | | Change |
Total assets | $ | 4,976 |
| | $ | 2,137 |
| | $ | 2,839 |
|
Total liabilities | 3,558 |
| | 875 |
| | 2,683 |
|
Total stockholders’ equity | 1,418 |
| | 1,262 |
| | 156 |
|
Total assets increased $2.8 billion from December 31, 2017 to December 31, 2018 primarily due to (i) the La Quinta acquisition, (ii) increased cash from borrowings and (iii) the contribution of assets from our former Parent upon our separation. Total liabilities increased $2.7 billion primarily due to (i) an increase in debt and other liabilities related to the La Quinta acquisition and (ii) the contribution of liabilities from our former Parent upon our separation. Total equity increased $156 million from December 31, 2017 to December 31, 2018 primarily due to contributions from our former Parent upon our separation.
LIQUIDITY AND CAPITAL RESOURCES
We intend to use the cash flow generated by our operations to create value for stockholders. Our asset-light business model, with low fixed costs and stable, recurring franchise fee revenue, generates attractive margins and cash flow. In addition to investments in the business, including acquisitions of brands and businesses that would expand our presence and capabilities in the lodging industry, we expect to return capital to our stockholders through dividends and/or share repurchases. We expect to pay a regular dividend and use excess cash to repurchase shares.
Historically, our net cash was transferred to Wyndham Worldwide, where it was centrally managed. Following the spin-off, we no longer participate in cash management and intercompany funding arrangements with Wyndham Worldwide. Our principal sources of liquidity following the spin-off are our cash on hand and our ability to generate cash through operations and financing activities, as well as any available funding arrangements we have entered into.
In April 2018, we issued $500 million of senior unsecured notes, which mature in 2026 and bear interest at a rate of 5.375% per year. In addition to the notes offering, in May 2018, we entered into new Senior Secured Credit Facilities (the “Credit Facilities”) in an aggregate principal amount of $2.35 billion, consisting of a Term Loan in an aggregate principal amount of $1.6 billion maturing in 2025 and a revolving credit facility in an aggregate principal amount of $750 million maturing in 2023, which was undrawn at closing and at December 31, 2018.
The proceeds from the notes offering and the term loan were used primarily to finance the cash consideration for the La Quinta acquisition, as well as to pay related fees and expenses and for general corporate purposes. See Note 5 - Acquisitions and Note 12 - Long-term Debt and Borrowing Arrangements to the Consolidated and Combined Financial Statements contained in Part IV of this report for a discussion of the La Quinta acquisition, the Credit Facilities and the notes offering.
The interest rate per annum applicable to our Term Loan is equal to, at Wyndham Hotels’ option, either a base rate plus a margin of 0.75% or LIBOR plus a margin of 1.75%. The revolving credit facility is subject to an interest rate per annum equal to, at Wyndham Hotels’ option, either a base rate plus a margin ranging from 0.50% to 1.00% or LIBOR plus a margin ranging from 1.50% to 2.00%, in either case based upon the total leverage ratio of the Company and its restricted subsidiaries.
The Federal Reserve has established the Alternative Reference Rates Committee to identify alternative reference rates in the event that LIBOR ceases to exist after 2021. Our credit facility, which includes its revolving credit facility and term loan, gives the option to use LIBOR as a base rate and our interest rate swaps are based on the one-month U.S. dollar LIBOR rate. In the event that LIBOR is no longer published, the credit facility allows us and the administrative agent of the facility to replace LIBOR with an alternative benchmark rate, subject to the approval of majority of lenders. The International Swaps and Derivatives Association is expected to issue protocols to allow swap parties to amend their existing contracts.
Our liquidity and access to capital may be impacted by our credit ratings, financial performance and global credit market conditions. We believe that our existing cash, cash equivalents, cash generated through operations and our expected access to financing facilities, together with funding through our revolving credit facility, will be sufficient to fund our operating activities, anticipated capital expenditures and growth needs.
CASH FLOW
The following table summarizes the changes in cash, cash equivalents and restricted cash during the years ended December 31, 2018, 2017 and 2016:
|
| | | | | | | | | | | |
| Year Ended December 31, |
| 2018 | | 2017 | | 2016 |
Cash provided by/(used in): | | | | | |
Operating activities | $ | 231 |
| | $ | 278 |
| | $ | 264 |
|
Investing activities | (1,728 | ) | | (197 | ) | | (114 | ) |
Financing activities | 1,808 |
| | (51 | ) | | (161 | ) |
Effects of changes in exchange rates on cash, cash equivalents and restricted cash | (4 | ) | | (1 | ) | | 1 |
|
Net change in cash, cash equivalents and restricted cash | $ | 307 |
|
| $ | 29 |
|
| $ | (10 | ) |
During 2018, net cash provided by operating activities decreased $47 million compared to the prior year primarily due to lower net income resulting from separation-related and transaction-related costs and $35 million of tax payments assumed with the La Quinta acquisition. Net cash used in investing activities increased $1.5 billion compared to the prior year, primarily due to the purchase price for our acquisition of La Quinta. Net cash provided by financing activities increased $1.9 billion compared to the prior year, primarily reflecting the proceeds from the borrowings used to fund the La Quinta acquisition.
During 2017, net cash provided by operating activities increased $14 million primarily due to increased cash from working capital. Net cash used in investing activities increased $83 million primarily due to our acquisition of AmericInn. Net cash used in financing activities decreased $110 million compared to 2016, primarily reflecting a $180 million reduction in transfers to Wyndham Worldwide under the cash pooling program partially offset by lower borrowings from Wyndham Worldwide.
Capital Deployment
We focus on optimizing cash flow and deploying capital to generate attractive risk-adjusted returns in ways that are consistent with, and further, our strategic objectives. We intend to continue to invest in select capital and technological improvements across our business. We may also seek to obtain additional franchise agreements and hotel management contracts on a strategic and selective basis as well as grow our business through acquisitions. In addition, we expect to return cash to stockholders through the payment of dividends and the repurchase of common stock.
During 2018, we spent $73 million on capital expenditures primarily for information technology enhancement projects as well as renovations at our Rio Mar property (which costs were funded primarily by previously received insurance proceeds). Our 2018 expenditures also included $7 million associated with our separation from Wyndham Worldwide. During 2019, we anticipate spending $60 to $65 million on capital expenditures, including expenditures of $10 to $15 million to integrate La Quinta.
In addition, during 2018, we spent $27 million ($13 million net of repayments) on development advance notes to acquire new franchise and management agreements. In an effort to support growth in our business, we intend to continue to provide development advance notes, which may include agreements with multi-unit owners, from time to time. We may also continue to provide other forms of financial support.
We expect that the majority of the expenditures that will be required to pursue our capital spending programs and strategic investments (other than any significant acquisitions) will be financed with cash flow generated through operations. Additional expenditures will be financed with general unsecured corporate borrowings.
Stock Repurchase Program
In May 2018, our Board of Directors approved a share repurchase plan, effective immediately following our spin-off, pursuant to which we have been authorized to purchase up to $300 million of Wyndham Hotels common stock. Under the plan, we may, from time to time, purchase our common stock through various means, including, without limitation, open
market transactions, privately negotiated transactions or tender offers, subject to the terms of the tax matters agreement entered into in connection with our spin-off.
Under our stock repurchase program, we repurchased approximately 2.3 million shares at an average price of $52.51 for a cost of $119 million during 2018. We had $181 million of remaining availability under our program as of December 31, 2018.
Dividend Policy
During each of the quarterly periods ended June 30, September 30, and December 31, 2018, we declared cash dividends of $0.25 per share ($75 million in aggregate for the year).
The declaration and payment of future dividends to holders of our common stock are at the discretion of our Board of Directors and depend upon many factors, including our financial condition, earnings, capital requirements of our business, covenants associated with certain debt obligations, legal requirements, regulatory constraints, industry practice and other factors that our Board of Directors deems relevant. There is no assurance that a payment of a dividend will occur in the future.
Foreign Earnings
Although the one-time mandatory deemed repatriation tax during 2017 and the territorial tax system created as a result of U.S. tax reform generally eliminate U.S. federal income taxes on dividends from foreign subsidiaries, we continue to assert that all of our undistributed foreign earnings of $39 million will be reinvested indefinitely as of December 31, 2018. In the event we determine not to continue to assert that all or part of our undistributed foreign earnings are permanently reinvested, such a determination in the future could result in the accrual and payment of additional foreign withholding taxes and U.S. taxes on currency transaction gains and losses, the determination of which is not practicable.
LONG-TERM DEBT COVENANTS
Our Credit Facilities contain customary covenants that, among other things, impose limitations on indebtedness; liens; mergers, consolidations, liquidations and dissolutions; dispositions, restricted debt payments, restricted payments and transactions with affiliates. Events of default in these Credit Facilities include, among others, failure to pay interest, principal and fees when due; breach of a covenant or warranty; acceleration of or failure to pay other debt in excess of a threshold amount; unpaid judgments in excess of a threshold amount, insolvency matters; and a change of control. The Credit Facilities require us to comply with a financial covenant to be tested quarterly, consisting of a maximum first-lien leverage ratio of 5.0 times. The ratio is calculated by dividing consolidated first lien indebtedness (as defined in the Credit Agreement) net of consolidated unrestricted cash as of the measurement date by consolidated EBITDA (as defined in the Credit Agreement), as measured on a trailing four-fiscal-quarter basis preceding the measurement date. As of December 31, 2018, our first-lien leverage ratio was 2.1 times.
The Indenture under which the senior notes due 2026 were issued contains covenants that limit, among other things, Wyndham Hotels’ ability and that of certain of its subsidiaries to (i) create liens on certain assets; (ii) enter into sale and leaseback transactions; and (iii) merge, consolidate or sell all or substantially all of Wyndham Hotels’ assets. These covenants are subject to a number of important exceptions and qualifications.
As of December 31, 2018, we were in compliance with the financial covenants described above.
SEASONALITY
While the hotel industry is seasonal in nature, periods of higher revenues vary property-by-property and performance is dependent on location and guest base. Based on historical performance, revenues from franchise and management contracts are generally higher in the second and third quarters than in the first or fourth quarters due to increased leisure travel during the spring and summer months. The seasonality of our business may cause fluctuations in our quarterly operating results, earnings and profit margins. As we expand into new markets and geographical locations, we may experience increased or different seasonality dynamics that create fluctuations in operating results different from the fluctuations we have experienced in the past.
COMMITMENTS AND CONTINGENCIES
We are involved in claims, legal and regulatory proceedings and governmental inquiries related to our business. Litigation is inherently unpredictable and, although we believe that our accruals are adequate and/or that we have valid defenses in these matters, unfavorable results could occur. As such, an adverse outcome from such proceedings for which claims are awarded in excess of the amounts accrued, if any, could be material to us with respect to earnings and/or cash flows in any given reporting period. As of December 31, 2018, the potential exposure resulting from adverse outcomes of such legal proceedings could, in the aggregate, range up to approximately $35 million in excess of recorded accruals, a significant portion of which is expected to be covered by insurance. However, we do not believe that the impact of such litigation should result in a material liability to us in relation to our financial position or liquidity. For a more detailed description of our commitments and contingencies see Note 13 - Commitments and Contingencies to the Consolidated and Combined Financial Statements contained in Part IV of this report.
CONTRACTUAL OBLIGATIONS
The following table summarizes our future contractual obligations for the years set forth below:
|
| | | | | | | | | | | | | | | | | | | | | | | | | | | |
| 2019 | | 2020 | | 2021 | | 2022 | | 2023 | | Thereafter | | Total |
Long-term debt | $ | 21 |
| | $ | 21 |
| | $ | 21 |
| | $ | 21 |
| | $ | 22 |
| | $ | 2,035 |
| | $ | 2,141 |
|
Interest on debt (a) | 101 |
| | 99 |
| | 96 |
| | 95 |
| | 94 |
| | 170 |
| | 655 |
|
Operating leases | 6 |
| | 4 |
| | 3 |
| | 2 |
| | — |
| | — |
| | 15 |
|
Purchase commitments (b) | 60 |
| | 23 |
| | 12 |
| | 11 |
| | 8 |
| | 16 |
| | 130 |
|
La Quinta tax liability (c) | 205 |
| | — |
| | — |
| | — |
| | — |
| | — |
| | 205 |
|
Total (d) (e) | $ | 393 |
|
| $ | 147 |
|
| $ | 132 |
|
| $ | 129 |
|
| $ | 124 |
|
| $ | 2,221 |
|
| $ | 3,146 |
|
______________________
| |
(a) | Includes interest on long-term debt; estimated using the stated interest rates on our senior notes and the swapped interest rates on our term loan. |
| |
(b) | Includes $89 million for information technology activities and $17 million for marketing-related activities. |
| |
(c) | Relates to liability which is expected to be paid in early 2019 to tax authorities and/or CorePoint related to the La Quinta acquisition. |
| |
(d) | Excludes a $16 million liability for unrecognized tax benefits associated with the accounting guidance for uncertainty in income taxes since it is not reasonably estimable to determine the periods in which such liability would be settled with the respective tax authorities. |
| |
(e) | Excludes guarantees for which the periods in which such commitments would be settled are not reasonably estimable (See Note 13 - Commitments and Contingencies to the Consolidated and Combined Financial Statements for further details). |
CRITICAL ACCOUNTING ESTIMATES AND POLICIES
In presenting our financial statements in conformity with U.S. GAAP, we are required to make estimates and assumptions that affect the amounts reported therein. Several of the estimates and assumptions we are required to make relate to matters that are inherently uncertain as they pertain to future events. However, events that are outside of our control cannot be predicted and, as such, they cannot be contemplated in evaluating such estimates and assumptions. If there is a significant unfavorable change to current conditions, it could result in a material impact to our consolidated and combined results of operations, financial position and liquidity. We believe that the estimates and assumptions we used when preparing our financial statements were the most appropriate at that time. Presented below are those accounting policies that we believe require subjective and complex judgments that could potentially affect reported results. However, the majority of our business activities are in environments where we are paid a fee for a service performed, and therefore the results of the majority of our recurring operations are recorded in our financial statements using accounting policies that are not particularly subjective, nor complex.
Impairment of Long-Lived Assets
With regard to goodwill and other indefinite-lived intangible assets recorded in connection with business combinations, we annually (during the fourth quarter of each year subsequent to completing our annual forecasting process), or more frequently if circumstances indicate that the value of goodwill may be impaired, review the reporting units’ carrying values as required by the guidance for goodwill and other intangible assets. This is done either by performing a qualitative assessment or utilizing the two-step process, with an impairment being recognized only where the fair value is less than carrying value. In any given year, we can elect to perform a qualitative assessment to determine whether it is more likely than not that the fair value of a reporting unit is in excess of its carrying value. If it is not more likely than not that the fair value is in excess of the carrying value, or we elect to bypass the qualitative assessment, we would use the two-step process. The qualitative factors evaluated include macroeconomic conditions, industry and market considerations, cost factors, overall financial performance,
our historical share price as well as other industry-specific considerations. We performed a quantitative assessment for impairment on each reporting unit’s goodwill for 2018. Based on the results of our quantitative assessments performed during the fourth quarter of 2018, we determined that no impairment existed, nor do we believe there is a material risk of it being impaired in the near term at our (i) hotel franchising, (ii) hotel management and (iii) owned hotel reporting units. To the extent estimated market-based valuation multiples and/or discounted cash flows are revised downward, we may be required to write-down all or a portion of goodwill, which would adversely impact earnings.
We also determine whether the carrying values of other indefinite-lived intangible assets are impaired on an annual basis or more frequently if indicators of potential impairment exist. Application of the other indefinite-lived intangible assets impairment test requires judgment in the assumptions underlying the approach used to determine fair value. The fair value of each other indefinite-lived intangible asset is estimated using a discounted cash flow methodology. This analysis requires significant judgments, including anticipated market conditions, operating expense trends, estimation of future cash flows, which are dependent on internal forecasts, and estimation of long-term rates of growth. The estimates used to calculate the fair value of other indefinite-lived intangible assets change from year to year based on operating results and market conditions. Changes in these estimates and assumptions could materially affect the determination of fair value and the other indefinite-lived intangible assets’ impairment.
We also evaluate the recoverability of our other long-lived assets, including property and equipment and amortizable intangible assets, if circumstances indicate impairment may have occurred, pursuant to guidance for impairment or disposal of long-lived assets. This analysis is performed by comparing the respective carrying values of the assets to the current and expected future cash flows, on an undiscounted basis, to be generated from such assets. Property and equipment is evaluated separately within each segment. If such analysis indicates that the carrying value of these assets is not recoverable, the carrying value of such assets is reduced to fair value.
Business Combinations
A component of our growth strategy has been to acquire and integrate businesses that complement our existing operations. We account for business combinations in accordance with the guidance for business combinations and related literature. Accordingly, we allocate the purchase price of acquired companies to the tangible and intangible assets acquired and liabilities assumed based upon their estimated fair values at the date of purchase. The difference between the purchase price and the fair value of the net assets acquired is recorded as goodwill.
In determining the fair values of assets acquired and liabilities assumed in a business combination, we use various recognized valuation methods including present value modeling and referenced market values, where available. Further, we make assumptions within certain valuation techniques including discount rates and timing of future cash flows. Valuations are performed by management or independent valuation specialists under management’s supervision, where appropriate. We believe that the estimated fair values assigned to the assets acquired and liabilities assumed are based on reasonable assumptions that marketplace participants would use. However, such assumptions are inherently uncertain and actual results could differ from those estimates.
Loyalty Programs
Wyndham Hotels operates the Wyndham Rewards loyalty program. Wyndham Rewards members accumulate points by staying in hotels operated under one of Wyndham Hotels’ brands. Wyndham Rewards members may also accumulate points by purchasing everyday services and products with their co-branded credit card.
Wyndham Hotels earns revenue from these programs (i) when a member stays at a participating hotel, club resort or vacation rental from a fee charged by Wyndham Hotels to the franchisee, which is based upon a percentage of room revenues generated from such stay which we recognize, net of redemptions, over time based upon loyalty point redemption patterns, including an estimate of loyalty points that will expire or will never be redeemed, and (ii) based upon a percentage of the member’s spending on the co-branded credit cards for which revenues are paid to Wyndham Hotels by a third-party issuing bank which we recognize over time based upon the redemption patterns of the loyalty points earned under the program, including an estimate of loyalty points that will expire or will never be redeemed.
As members earn points through the Wyndham Rewards loyalty program, Wyndham Hotels records a liability for the estimated future redemption costs, which is calculated based on (i) an estimated cost per point and (ii) an estimated redemption rate of the overall points earned, which is determined through historical experience, current trends and the use of an actuarial analysis.
Hotel Management Guarantees
We have entered into performance guarantees related to certain hotels that we manage. Upon the inception date of the guarantee, we record a performance liability that is measured at fair value. In order to estimate its fair value, we use a weighted probability approach to determine the probability of possible outcomes. The valuation methodology requires that we make certain assumptions and judgments regarding discount rates, volatility and hotel operating results. The fair value is established at inception and is not revalued due to future changes in assumptions.
Certain of our performance guarantees have recapture provisions, which allow us to recover amounts funded under such guarantees. We record receivables for amounts expected to be recovered in the future. We make certain assumptions and judgments regarding the recoverability of these receivables, which includes reviewing hotel operating results and current hotel net operating income projections.
Income Taxes
Prior to our spin-off, current and deferred income taxes and related tax expense have been determined based on Wyndham Hotels’ stand-alone results by applying a separate return methodology, as if the Wyndham Hotels’ entities were separate taxpayers in the respective jurisdictions. We recognize deferred tax assets and liabilities based on the differences between the financial statement carrying amounts and the tax basis of assets and liabilities using currently enacted tax rates. We regularly review our deferred tax assets to assess their potential realization and establish a valuation allowance for portions of such assets that we believe will not be ultimately realized. In performing this review, we make estimates and assumptions regarding projected future taxable income, the expected timing of the reversals of existing temporary differences and the implementation of tax planning strategies. A change in these assumptions may increase or decrease our valuation allowance resulting in an increase or decrease in our effective tax rate, which could materially impact our results of operations.
For tax positions we have taken or expect to take in our tax return, we apply a more likely than not threshold, under which we must conclude a tax position is more likely than not to be sustained, assuming that the position will be examined by the appropriate taxing authority that has full knowledge of all relevant information, in order to recognize or continue to recognize the benefit. In determining our provision for income taxes, we use judgment, reflecting our estimates and assumptions, in applying the more likely than not threshold.
RECENTLY ADOPTED AND NEW ACCOUNTING PRONOUNCEMNTS
For a detailed description of recently adopted and new accounting pronouncements see Note 2 - Summary of Significant Accounting Policies to the Consolidated and Combined Financial Statements contained in Part IV of this report.
OFF-BALANCE SHEET ARRANGEMENTS
There were no off-balance sheet transactions, arrangements or other relationships with unconsolidated entities or other persons in 2018, 2017 and 2016 that have, or are reasonably likely to have, a current or future effect on our financial condition, revenues or expenses, results of operations, liquidity, capital expenditures or capital resources.
Item 7A. Quantitative and Qualitative Disclosures About Market Risks.
We use various financial instruments, including interest swap contracts, to reduce the interest rate risk related to our debt. We also use foreign currency forwards to manage and reduce the foreign currency exchange rate risk associated with our foreign currency denominated receivables and payables, and forecasted royalties, forecasted earnings and cash flows of foreign subsidiaries and other transactions.
We are exclusively an end user of these instruments, which are commonly referred to as derivatives. We do not engage in trading, market making or other speculative activities in the derivatives markets. More detailed information about these financial instruments is provided in Note 9 - Fair Value to the Consolidated and Combined Financial Statements. Our principal market exposures are interest and currency exchange rate risks.
We assess our exposures to changes in interest rates utilizing a sensitivity analysis. The sensitivity analysis measures the potential impact in earnings, fair values and cash flows based on a hypothetical 10% change (increase and decrease) in interest rates. Our variable-rate borrowings, which include our revolving credit facility and our Term Loan, a portion of which has been swapped to a fixed interest rate, expose us to risks caused by fluctuations in the applicable interest rates. The total outstanding balance of such variable-rate borrowings, net of swaps, was $596 million as of December 31, 2018. A hypothetical 10% change in our effective weighted average interest rate on our variable-rate borrowings would result in
approximately $1 million increase or decrease to our annual long-term debt interest expense, and a one-point change in the underlying interest rates would result in approximately a $6 million increase or decrease in our annual interest expense.
The fair values of cash and cash equivalents, trade receivables, accounts payable and accrued expenses and other current liabilities approximate their carrying values due to the short-term nature of these assets and liabilities.
We have foreign currency rate exposure to exchange rate fluctuations worldwide, particularly with respect to the Canadian Dollar, the Chinese Yuan, the Euro, the British Pound and the Argentine Peso. We anticipate that such foreign currency exchange rate risk will remain a market risk exposure for the foreseeable future.
We use a current market pricing model to assess the changes in the value of our foreign currency derivatives used by us to hedge underlying exposure that primarily consists of our non-functional-currency current assets and liabilities. The primary assumption used in these models is a hypothetical 10% weakening or strengthening of the U.S. dollar against all our currency exposures as of December 31, 2018. The gains and losses on the hedging instruments are largely offset by the gains and losses on the underlying assets, liabilities or expected cash flows. As of December 31, 2018, the absolute notional amount of our outstanding foreign exchange hedging instruments was $60 million. We have determined through such analyses, that a hypothetical 10% change in foreign currency exchange rates would have resulted in approximately a $5 million increase or decrease to the fair value of our outstanding forward foreign currency exchange contracts, which would generally be offset by an opposite effect on the underlying exposure being economically hedged.
Argentina is now considered to be a highly inflationary economy. As of December 31, 2018, we had total net assets of $11 million in Argentina.
Our total market risk is influenced by a wide variety of factors including the volatility present within the markets and the liquidity of the markets. There are certain limitations inherent in the sensitivity analyses presented. While probably the most meaningful analysis, these “shock tests” are constrained by several factors, including the necessity to conduct the analysis based on a single point in time and the inability to include the complex market reactions that normally would arise from the market shifts modeled.
Item 8. Financial Statements and Supplementary Data.
The financial statements required to be filed pursuant to this Item 8 are appended to this Annual Report on Form 10-K. A list of the financial statements filed herewith is found in Part IV, Item 15 commencing on page F-1 hereof.
Item 9. Changes in and Disagreements with Accountants on Accounting and Financial Disclosure.
Not applicable.
Item 9A. Controls and Procedures.
Disclosure Controls and Procedures. Our management, with the participation of our principal executive and principal financial officers, has evaluated the effectiveness of our disclosure controls and procedures (as such term is defined in Rule 13a-15(e) under the Securities Exchange Act of 1934, as amended (the “Exchange Act”)) as of the end of the period covered by this report. Based on such evaluation, our principal executive and principal financial officers have concluded that, as of the end of such period, our disclosure controls and procedures were effective and operating to provide reasonable assurance that information required to be disclosed by us in the reports that we file or submit under the Exchange Act is recorded, processed, summarized and reported within the time periods specified in the rules and forms of the SEC, and to provide reasonable assurance that such information is accumulated and communicated to our management, including our principal executive and principal financial officers, as appropriate, to allow timely decisions regarding required disclosure.
Management’s Report on Internal Control Over Financial Reporting. Our management is responsible for establishing and maintaining adequate internal control over financial reporting, as defined in Rule 13a-15(f) under the Exchange Act. Our management assessed the effectiveness of our internal control over financial reporting as of December 31, 2018. In making this assessment, management used the criteria established in Internal Control - Integrated Framework (2013) issued by the Committee of Sponsoring Organizations (COSO) of the Treadway Commission. Based on this assessment, our management believes that, as of December 31, 2018, our internal control over financial reporting is effective. The Company acquired La Quinta on May 30, 2018. SEC guidance permits companies to exclude certain acquisitions from the assessment of internal control over financial reporting during the first year following acquisition. Accordingly, management has excluded La Quinta from its assessment of the effectiveness of the Company’s internal control over financial reporting as of December 31, 2018. La Quinta represents approximately 46% and 27% of total assets and net revenues, respectively, of the consolidated financial statement amounts as of and for the year ended December 31, 2018. Our independent registered public accounting
firm has issued an attestation report on the effectiveness of our internal control over financial reporting, which is included within their audit opinion on page F-2.
There have been no changes in our internal control over financial reporting (as such term is defined in Rule 13a-15(f) under the Exchange Act) during the most recent fiscal quarter to which this report relates that have materially affected or are reasonably likely to materially affect our internal control over financial reporting.
Item 9B. Other Information.
None.
PART III
Item 10. Directors, Executive Officers and Corporate Governance.
Except as otherwise disclosed, the information required by this item is included in the Proxy Statement for our 2019 Annual Meeting of Shareholders and is incorporated by reference in this report.
Identification of Executive Officers.
Geoffrey A. Ballotti, 57, serves as a member of our Board of Directors and as our President and Chief Executive Officer. From March 2014 to May 2018, Mr. Ballotti served as President and Chief Executive Officer of Wyndham Hotel Group, which was a subsidiary of Wyndham Worldwide. From March 2008 to March 2014, Mr. Ballotti served as Chief Executive Officer of Wyndham Destination Network, which was a subsidiary of Wyndham Worldwide. From October 2003 to March 2008, Mr. Ballotti was President of North America Division of Starwood Hotels and Resorts Worldwide. From 1989 to 2003, Mr. Ballotti held leadership positions of increasing responsibility at Starwood Hotels and Resorts Worldwide including President of Starwood North America, Executive Vice President, Operations, Senior Vice President, Southern Europe and Managing Director, Ciga Spa, Italy. Prior to joining Starwood Hotels and Resorts Worldwide, Mr. Ballotti was a Banking Officer in the Commercial Real Estate Group at the Bank of New England.
David B. Wyshner, 51, serves as our Chief Financial Officer. From August 2017 to May 2018, Mr. Wyshner served as Executive Vice President and Chief Financial Officer of Wyndham Worldwide. Mr. Wyshner served as Chief Financial Officer of Avis Budget Group, Inc. from August 2006 to June 2017 and also served as Avis Budget Group’s President from January 2016 to June 2017. Mr. Wyshner previously held several key roles at Cendant Corporation, starting in 1999, including as Executive Vice President and Treasurer, and Vice Chairman of the Travel Content Division, which included the Avis and Budget vehicle rental businesses as well as many of our businesses. Prior to joining Cendant Corporation, Mr. Wyshner served as Vice President in Merrill Lynch & Co.’s investment banking division.
Michele Allen, 44, serves as our Executive Vice President and Treasurer. From April 2015 to May 2018, Ms. Allen served as Senior Vice President of Finance for Wyndham Worldwide. From August 2006 to March 2015, Ms. Allen served in positions of increasing responsibility at Wyndham Hotel Group including Senior Vice President of Finance and Controller. Ms. Allen began her career in public accounting at Deloitte & Touche LLP.
Tom H. Barber, 47, serves as our Global Chief Development Officer. From January 2012 to May 2018, Mr. Barber served as Senior Vice President, M&A and Operational Excellence at Wyndham Worldwide. From June 2004 until January 2012, Mr. Barber served as Director, Mergers & Acquisitions at Credit Suisse Securities. Prior to joining Credit Suisse Securities, he served as Manager, Strategy Consulting at Gemini Consulting and as a business development and product manager at Microsoft Corporation.
Paul F. Cash, 49, serves as our General Counsel. From October 2017 to May 2018, Mr. Cash served as Executive Vice President and General Counsel of Wyndham Hotel Group. From April 2005 to September 2017, Mr. Cash served as Executive Vice President and General Counsel and in legal executive positions with increasing leadership responsibility for Wyndham Destination Network. From January 2003 to April 2005, Mr. Cash was a partner in the Mergers and Acquisitions, International and Entertainment and New Media practice groups of Alston & Bird LLP and from February 1997 to December 2002 he was an associate at Alston & Bird LLP. From August 1995 until February 1997, Mr. Cash was an associate at the law firm Pünder, Volhard, Weber & Axster in Frankfurt, Germany.
Lisa Borromeo Checchio, 38, serves as our Chief Marketing Officer. From May 2018 to January 2019, Ms. Checchio served as our Senior Vice President and Chief Marketing Officer. From April 2017 to May 2018, Ms. Checchio served as Senior Vice President, Global Brands for Wyndham Hotel Group. From August 2015 to April 2017, Ms. Checchio served as Vice President, Brand Marketing for Wyndham Hotel Group. From July 2004 to August 2015, Ms. Checchio held several marketing positions and served as Brand Marketing and Advertising Director for JetBlue Airways.
Mary R. Falvey, 58, serves as our Chief Administrative Officer. From August 2006 to May 2018, Ms. Falvey served as Executive Vice President and Chief Human Resources Officer of Wyndham Worldwide. Ms. Falvey was Executive Vice President, Global Human Resources for Cendant Corporation’s Vacation Network Group from April 2005 to July 2006. From March 2000 to April 2005, Ms. Falvey served as Executive Vice President, Human Resources for RCI. From January 1998 to March 2000, Ms. Falvey was Vice President of Human Resources for Cendant Corporation’s Hotel Division and Corporate
Contact Center group. Prior to joining Cendant Corporation, Ms. Falvey held various leadership positions in the human resources division of Nabisco Foods Company.
Robert D. Loewen, 53, serves as our Chief Operating Officer. From March 2013 to May 2018, Mr. Loewen served as Executive Vice President and Chief Operating Officer for Wyndham Hotel Group. From April 2002 to March 2013, Mr. Loewen served as Chief Financial Officer for Wyndham Hotel Group. Mr. Loewen joined Wyndham Worldwide in April 2000 as Director, Corporate Audit.
Nicola Rossi, 52, serves as our Chief Accounting Officer. From July 2006 to May 2018, Mr. Rossi served as Senior Vice President and Chief Accounting Officer for Wyndham Worldwide. Mr. Rossi was Vice President and Controller of Cendant’s Hotel Group from June 2004 to July 2006. From April 2002 to June 2004, Mr. Rossi served as Vice President, Corporate Finance for Cendant. From April 2000 to April 2002, Mr. Rossi was Corporate Controller and from June 1999 to March 2000 was Assistant Corporate Controller of Jacuzzi Brands, Inc.
Scott R. Strickland, 48, serves as our Chief Information Officer. From March 2017 to May 2018, Mr. Strickland served as Chief Information Officer of Wyndham Hotel Group. From November 2011 to March 2017, Mr. Strickland served as Chief Information Officer for Denon Marantz Electronics. From February 2005 to June 2010, Mr. Strickland served as Chief Information Officer for Black & Decker HHI. From 1999 to 2005, Mr. Strickland served as an Associate Partner with PricewaterhouseCoopers.
Item 11. Executive Compensation.
The information required by this item is included in the Proxy Statement under the captions “Compensation of Directors”, “Executive Compensation” and “Committees of the Board” and is incorporated by reference in this report.
Item 12. Security Ownership of Certain Beneficial Owners and Management and Related Stockholder Matters.
Equity Compensation Plan Information as of December 31, 2018
|
| | | |
Plan Category | Number of securities to be issued upon exercise of outstanding options, warrants and rights | Weighted-average exercise price of outstanding options, warrants and rights | Number of securities remaining available for future issuance under equity compensation plans (excluding securities reflected in the first column) |
Equity compensation plans approved by security holders | 1.6 million (a) | $61.35 (b) | 7.5 million (c) |
Equity compensation plans not approved by security holders | None | Not applicable | Not applicable |
______________________
| |
(a) | Consists of shares issuable upon exercise of stock settled stock appreciation rights, stock options, restricted stock units and deferred stock units under the 2018 Equity and Incentive Plan. |
| |
(b) | Consists of weighted-average exercise price of outstanding stock settled stock appreciation rights, stock options and restricted stock units |
| |
(c) | Consists of shares available for future grants under the 2018 Equity and Incentive Plan. |
The remaining information required by this item is included in the Proxy Statement under the caption “Ownership of Company Stock” and is incorporated by reference in this report.
Item 13. Certain Relationships and Related Transactions, and Director Independence.
The information required by this item is included in the Proxy Statement under the captions “Related Party Transactions” and “Governance of the Company” and is incorporated by reference in this report.
Item 14. Principal Accountant Fees and Services.
The information required by this item is included in the Proxy Statement under the captions “Disclosure About Fees” and “Pre-Approval of Audit and Non-Audit Services” and is incorporated by reference in this report.
PART IV
Item 15. Exhibits and Financial Statements Schedules.
Item 15 (a)(1) Financial Statements.
See Financial Statements and Financial Statements Index commencing on page F-1 hereof.
Item 15 (a)(3) Exhibits.
See Exhibit Index commencing on page G-1 hereof.
Item 16. Form 10-K Summary.
None.
SIGNATURES
Pursuant to the requirements of the Section 13 or 15(d) of the Securities Exchange Act of 1934, the Registrant has duly caused this report to be signed on its behalf by the undersigned thereunto duly authorized.
|
| |
WYNDHAM HOTELS & RESORTS, INC. |
| |
By: | /s/ GEOFFREY A. BALLOTTI |
| Geoffrey A. Ballotti |
| President and Chief Executive Officer |
| (Principal Executive Officer) |
Date: | February 14, 2019 |
Pursuant to the requirements of the Securities Exchange Act of 1934, this report has been signed below by the following persons on behalf of the Registrant and in the capacities and on the dates indicated.
|
| | |
Signature | Title | Date |
| | |
/s/ GEOFFREY A. BALLOTTI | President, Chief Executive Officer and Director | February 14, 2019 |
Geoffrey A. Ballotti | (Principal Executive Officer) | |
| | |
/s/ DAVID B. WYSHNER | Chief Financial Officer | February 14, 2019 |
David B. Wyshner | (Principal Financial Officer) | |
| | |
/s/ NICOLA ROSSI | Chief Accounting Officer | February 14, 2019 |
Nicola Rossi | (Principal Accounting Officer) | |
| | |
/s/ STEPHEN P. HOLMES | Non-Executive Chairman of the Board of Directors | February 14, 2019 |
Stephen P. Holmes | |
| | |
/s/ MYRA J. BIBLOWIT | Director | February 14, 2019 |
Myra J. Biblowit | | |
| | |
/s/ JAMES E. BUCKMAN | Director | February 14, 2019 |
James E. Buckman | | |
| | |
/s/ BRUCE B. CHURCHILL | Director | February 14, 2019 |
Bruce B. Churchill | | |
| | |
/s/ MUKUL DEORAS | Director | February 14, 2019 |
Mukul Deoras | | |
| | |
/s/ THE RIGHT HONOURABLE BRIAN MULRONEY | Director | February 14, 2019 |
The Right Honourable Brian Mulroney | | |
| | |
/s/ PAULINE D.E. RICHARDS | Director | February 14, 2019 |
Pauline D.E. Richards | | |
INDEX TO ANNUAL CONSOLIDATED AND COMBINED FINANCIAL STATEMENTS
|
| |
| Page |
Report of Independent Registered Public Accounting Firm | |
Consolidated and Combined Statements of Income for the years ended December 31, 2018, 2017 and 2016 | |
Consolidated and Combined Comprehensive Income for the years ended December 31, 2018, 2017 and 2016 | |
Consolidated and Combined Balance Sheets as of December 31, 2018 and 2017 | |
Consolidated and Combined Statements of Cash Flows for the years ended December 31, 2018, 2017 and 2016 | |
Consolidated and Combined Statements of Equity for the years ended December 31, 2018, 2017 and 2016 | |
Notes to Consolidated and Combined Financial Statements | |
REPORT OF INDEPENDENT REGISTERED PUBLIC ACCOUNTING FIRM
To the Board of Directors and Stockholders of
Wyndham Hotels & Resorts, Inc.
Opinions on the Financial Statements and Internal Control over Financial Reporting
We have audited the accompanying consolidated and combined balance sheets of Wyndham Hotels & Resorts, Inc. and subsidiaries (the “Company”), which, prior to its separation from Wyndham Worldwide Corporation (“Wyndham Worldwide,” now known as Wyndham Destinations, Inc.), consisted of the entities holding substantially all of the assets and liabilities of the Wyndham Worldwide Hotel Group business used in managing and operating the hotel businesses of Wyndham Worldwide, as of December 31, 2018 and 2017, the related consolidated and combined statements of income, comprehensive income, equity, and cash flows, for each of the three years in the period ended December 31, 2018, and the related notes (collectively referred to as the “financial statements”). We also have audited the Company’s internal control over financial reporting as of December 31, 2018, based on criteria established in Internal Control - Integrated Framework (2013) issued by the Committee of Sponsoring Organizations of the Treadway Commission (COSO).
In our opinion, the financial statements referred to above present fairly, in all material respects, the financial position of the Company as of December 31, 2018 and 2017, and the results of its operations and its cash flows for each of the three years in the period ended December 31, 2018, in conformity with accounting principles generally accepted in the United States of America. Also, in our opinion, the Company maintained, in all material respects, effective internal control over financial reporting as of December 31, 2018, based on criteria established in Internal Control - Integrated Framework (2013) issued by COSO.
As described in Management’s Report on Internal Control over Financial Reporting, management excluded from its assessment the internal control over financial reporting at La Quinta Holdings Inc.’s hotel franchising and hotel management business (“La Quinta”), which was acquired on May 30, 2018 and whose financial statements constitute 46% and 27% of total assets and net revenues, respectively, of the consolidated financial statement amounts as of and for the year ended December 31, 2018. Accordingly, our audit did not include the internal control over financial reporting at La Quinta.
Change in Accounting Principle
As discussed in Note 2 to the financial statements, effective January 1, 2018, the Company adopted Financial Accounting Standards Board Accounting Standards Codification 606, Revenues from Contracts with Customers, utilizing the full retrospective approach.
Emphasis of a Matter
As described in Note 1 and Note 17 to the financial statements, the financial statements have been prepared on a stand-alone basis and prior to May 31, 2018 are derived from the consolidated financial statements and accounting records of Wyndham Worldwide. Prior to May 31, 2018, the combined financial statements also include expense allocations for certain corporate functions and services historically provided by Wyndham Worldwide. These allocations may not be reflective of the actual expense that would have been incurred had the Company operated as an independent, publicly traded company for the periods presented. Transactions with Wyndham Worldwide are disclosed in Note 17 to the financial statements.
Basis for Opinions
The Company’s management is responsible for these financial statements, for maintaining effective internal control over financial reporting, and for its assessment of the effectiveness of internal control over financial reporting, included in the accompanying Management’s Report on Internal Control over Financial Reporting. Our responsibility is to express an opinion on these financial statements and an opinion on the Company’s internal control over financial reporting based on our audits. We are a public accounting firm registered with the Public Company Accounting Oversight Board (United States) (PCAOB) and are required to be independent with respect to the Company in accordance with the U.S. federal securities laws and the applicable rules and regulations of the Securities and Exchange Commission and the PCAOB.
We conducted our audits in accordance with the standards of the PCAOB. Those standards require that we plan and perform the audits to obtain reasonable assurance about whether the financial statements are free of material misstatement, whether due to error or fraud, and whether effective internal control over financial reporting was maintained in all material respects.
Our audits of the financial statements included performing procedures to assess the risks of material misstatement of the financial statements, whether due to error or fraud, and performing procedures to respond to those risks. Such procedures included examining, on a test basis, evidence regarding the amounts and disclosures in the financial statements. Our audits also included evaluating the accounting principles used and significant estimates made by management, as well as evaluating the overall presentation of the financial statements. Our audit of internal control over financial reporting included obtaining an understanding of internal control over financial reporting, assessing the risk that a material weakness exists, and testing and evaluating the design and operating effectiveness of internal control based on the assessed risk. Our audits also included performing such other procedures as we considered necessary in the circumstances. We believe that our audits provide a reasonable basis for our opinions.
Definition and Limitations of Internal Control over Financial Reporting
A company’s internal control over financial reporting is a process designed to provide reasonable assurance regarding the reliability of financial reporting and the preparation of financial statements for external purposes in accordance with generally accepted accounting principles. A company’s internal control over financial reporting includes those policies and procedures that (1) pertain to the maintenance of records that, in reasonable detail, accurately and fairly reflect the transactions and dispositions of the assets of the company; (2) provide reasonable assurance that transactions are recorded as necessary to permit preparation of financial statements in accordance with generally accepted accounting principles, and that receipts and expenditures of the company are being made only in accordance with authorizations of management and directors of the company; and (3) provide reasonable assurance regarding prevention or timely detection of unauthorized acquisition, use, or disposition of the company’s assets that could have a material effect on the financial statements.
Because of its inherent limitations, internal control over financial reporting may not prevent or detect misstatements. Also, projections of any evaluation of effectiveness to future periods are subject to the risk that controls may become inadequate because of changes in conditions, or that the degree of compliance with the policies or procedures may deteriorate.
/s/ Deloitte & Touche LLP
New York, New York
February 14, 2019
We have served as the Company’s auditor since 2017.
WYNDHAM HOTELS & RESORTS, INC.
CONSOLIDATED AND COMBINED STATEMENTS OF INCOME
(In millions, except per share amounts)
|
| | | | | | | | | | | |
| Year Ended December 31, |
| 2018 | | 2017 | | 2016 |
Net revenues | | | | | |
Royalties and franchise fees | $ | 441 |
| | $ | 364 |
| | $ | 354 |
|
Marketing, reservation and loyalty | 491 |
| | 371 |
| | 375 |
|
Hotel management | 124 |
| | 108 |
| | 107 |
|
License and other revenues from former Parent | 111 |
| | 75 |
| | 65 |
|
Cost reimbursements | 586 |
| | 264 |
| | 271 |
|
Other | 115 |
| | 98 |
| | 97 |
|
Net revenues | 1,868 |
| | 1,280 |
| | 1,269 |
|
Expenses | | | | | |
Marketing, reservation and loyalty | 486 |
| | 373 |
| | 376 |
|
Operating | 182 |
| | 183 |
| | 168 |
|
General and administrative | 119 |
| | 88 |
| | 83 |
|
Cost reimbursements | 586 |
| | 264 |
| | 271 |
|
Depreciation and amortization | 99 |
| | 75 |
| | 73 |
|
Separation-related | 77 |
| | 3 |
| | — |
|
Transaction-related, net | 36 |
| | 3 |
| | 1 |
|
Impairment | — |
| | 41 |
| | — |
|
Restructuring | — |
| | 1 |
| | 2 |
|
Total expenses | 1,585 |
| | 1,031 |
| | 974 |
|
Operating income | 283 |
| | 249 |
| | 295 |
|
Interest expense, net | 60 |
| | 6 |
| | 1 |
|
Income before income taxes | 223 |
| | 243 |
| | 294 |
|
Provision for income taxes | 61 |
| | 13 |
| | 118 |
|
Net income | $ | 162 |
| | $ | 230 |
| | $ | 176 |
|
| | | | | |
Earnings per share | | | | | |
Basic | $ | 1.62 |
| | $ | 2.31 |
| | $ | 1.76 |
|
Diluted | 1.62 |
| | 2.31 |
| | 1.76 |
|
See Notes to Consolidated and Combined Financial Statements.
F-4
WYNDHAM HOTELS & RESORTS, INC.
CONSOLIDATED AND COMBINED STATEMENTS OF COMPREHENSIVE INCOME
(In millions)
|
| | | | | | | | | | | |
| Year Ended December 31, |
| 2018 | | 2017 | | 2016 |
Net income | $ | 162 |
| | $ | 230 |
| | $ | 176 |
|
Other comprehensive income/(loss), net of tax | | | | | |
Foreign currency translation adjustments | (9 | ) | | 5 |
| | (1 | ) |
Unrealized losses on cash flow hedges | (4 | ) | | — |
| | — |
|
Other comprehensive income/(loss), net of tax | (13 | ) | | 5 |
| | (1 | ) |
Comprehensive income | $ | 149 |
| | $ | 235 |
| | $ | 175 |
|
See Notes to Consolidated and Combined Financial Statements.
F-5
WYNDHAM HOTELS & RESORTS, INC.
CONSOLIDATED AND COMBINED BALANCE SHEETS
(In millions)
|
| | | | | | | |
| December 31, 2018 | | December 31, 2017 |
Assets | | | |
Current assets: | | | |
Cash and cash equivalents | $ | 366 |
| | $ | 57 |
|
Trade receivables, net | 293 |
| | 194 |
|
Prepaid expenses | 40 |
| | 29 |
|
Other current assets | 152 |
| | 54 |
|
Total current assets | 851 |
| | 334 |
|
Property and equipment, net | 326 |
| | 250 |
|
Goodwill | 1,547 |
| | 423 |
|
Trademarks, net | 1,397 |
| | 692 |
|
Franchise agreements and other intangibles, net | 590 |
| | 251 |
|
Other non-current assets | 265 |
| | 187 |
|
Total assets | $ | 4,976 |
| | $ | 2,137 |
|
Liabilities and equity | | | |
Current liabilities: | | | |
Current portion of long-term debt | $ | 21 |
| | $ | — |
|
Current portion of debt due to former Parent | — |
| | 103 |
|
Accounts payable | 61 |
| | 38 |
|
Deferred income | 109 |
| | 84 |
|
Accrued expenses and other current liabilities | 502 |
| | 186 |
|
Total current liabilities | 693 |
| | 411 |
|
Long-term debt | 2,120 |
| | — |
|
Debt due to former Parent | — |
| | 81 |
|
Deferred income taxes | 399 |
| | 173 |
|
Deferred income | 164 |
| | 164 |
|
Other non-current liabilities | 182 |
| | 46 |
|
Total liabilities | 3,558 |
| | 875 |
|
Commitments and contingencies (Note 13) |
|
| |
|
|
Stockholders’ equity: | | | |
Preferred stock, $.01 par value, authorized 6,000,000 shares, none issued and outstanding | — |
| | — |
|
Common stock, $.01 par value, authorized 600,000,000 shares, 100,360,236 issued as of 2018 and none issued and outstanding as of 2017 | 1 |
| | — |
|
Treasury stock, at cost – 2,269,169 shares in 2018 | (119 | ) | | — |
|
Additional paid-in capital | 1,475 |
| | — |
|
Retained earnings | 69 |
| | — |
|
Former Parent’s net investment | — |
| | 1,257 |
|
Accumulated other comprehensive income | (8 | ) | | 5 |
|
Total stockholders’ equity | 1,418 |
| | 1,262 |
|
Total liabilities and equity | $ | 4,976 |
| | $ | 2,137 |
|
See Notes to Consolidated and Combined Financial Statements.
F-6
WYNDHAM HOTELS & RESORTS, INC.
CONSOLIDATED AND COMBINED STATEMENTS OF CASH FLOWS
(In millions)
|
| | | | | | | | | | | |
| Year Ended December 31, |
| 2018 | | 2017 | | 2016 |
Operating Activities | | | | | |
Net income | $ | 162 |
| | $ | 230 |
| | $ | 176 |
|
Adjustments to reconcile net income to net cash provided by operating activities: | | | | | |
Depreciation and amortization | 99 |
| | 75 |
| | 73 |
|
Gain on sale | (23 | ) | | — |
| | — |
|
Impairment charges | — |
| | 41 |
| | — |
|
Deferred income taxes | — |
| | (91 | ) | | 26 |
|
Stock-based compensation | 25 |
| | — |
| | — |
|
Net change in assets and liabilities: | | | | | |
Trade receivables | (55 | ) | | (10 | ) | | — |
|
Prepaid expenses | 1 |
| | (5 | ) | | 1 |
|
Other current assets | (22 | ) | | — |
| | 8 |
|
Accounts payable, accrued expenses and other current liabilities | 85 |
| | 24 |
| | (13 | ) |
Payment of tax liability assumed in La Quinta acquisition | (35 | ) | | — |
| | — |
|
Deferred income | (3 | ) | | 15 |
| | (3 | ) |
Payments of development advance notes | (27 | ) | | (8 | ) | | (9 | ) |
Proceeds from development advance notes | 14 |
| | 7 |
| | 3 |
|
Long‑term assets | 1 |
| | (6 | ) | | (6 | ) |
Other, net | 9 |
| | 6 |
| | 8 |
|
Net cash provided by operating activities | 231 |
| | 278 |
| | 264 |
|
Investing Activities | | | | | |
Property and equipment additions | (73 | ) | | (46 | ) | | (42 | ) |
Acquisition of business, net of cash acquired | (1,703 | ) | | (140 | ) | | (70 | ) |
Proceeds from sale of assets, net | 27 |
| | — |
| | — |
|
Loan advances | (7 | ) | | (21 | ) | | (2 | ) |
Loan repayments | 20 |
| | — |
| | — |
|
Insurance proceeds | 14 |
| | 11 |
| | — |
|
Other, net | (6 | ) | | (1 | ) | | — |
|
Net cash used in investing activities | (1,728 | ) | | (197 | ) | | (114 | ) |
Financing Activities | | | | | |
Net transfer to former Parent | (38 | ) | | (59 | ) | | (239 | ) |
Proceeds from borrowings from former Parent | 13 |
| | 9 |
| | 79 |
|
Capital lease payments | (3 | ) | | (1 | ) | | (2 | ) |
Proceeds from long-term debt | 2,100 |
| | — |
| | — |
|
Principal payments on long-term debt | (4 | ) | | — |
| | — |
|
Debt issuance costs | (28 | ) | | — |
| | — |
|
Capital contribution from former Parent | 106 |
| | — |
| | — |
|
Dividend to former Parent | (109 | ) | | — |
| | — |
|
Dividends to shareholders | (77 | ) | | — |
| | — |
|
Repurchases of common stock | (117 | ) | | — |
| | — |
|
Net share settlement of incentive equity awards | (34 | ) | | — |
| | — |
|
Other, net | (1 | ) | | — |
| | 1 |
|
Net cash provided by/(used in) financing activities | 1,808 |
| | (51 | ) | | (161 | ) |
Effect of changes in exchange rates on cash, cash equivalents and restricted cash | (4 | ) | | (1 | ) | | 1 |
|
Net increase/(decrease) in cash, cash equivalents and restricted cash | 307 |
| | 29 |
| | (10 | ) |
Cash, cash equivalents and restricted cash, beginning of period | 59 |
| | 30 |
| | 40 |
|
Cash, cash equivalents and restricted cash, end of period | $ | 366 |
| | $ | 59 |
| | $ | 30 |
|
See Notes to Consolidated and Combined Financial Statements.
F-7
WYNDHAM HOTELS & RESORTS, INC.
CONSOLIDATED AND COMBINED STATEMENTS OF EQUITY
(In millions)
|
| | | | | | | | | | | | | | | | | | | | | | | | | | | | | | |
| Common Shares Outstanding | | Common Stock | | Treasury Stock | | Former Parent’s Net Investment | | Additional Paid-in Capital | | Retained Earnings | | Accumulated Other Comprehensive Income/(Loss) | | Total Equity |
Balance as of December 31, 2015 | — |
| | $ | — |
| | $ | — |
| | $ | 1,149 |
| | $ | — |
| | $ | — |
| | $ | 1 |
| | $ | 1,150 |
|
Net income | — |
| | — |
| | — |
| | 176 |
| | — |
| | — |
| | — |
| | 176 |
|
Net transfers to parent | — |
| | — |
| | — |
| | (239 | ) | | — |
| | — |
| | — |
| | (239 | ) |
Other comprehensive loss | | | | | | | | | | | | | (1 | ) | | (1 | ) |
Balance as of December 31, 2016 | — |
| | — |
| | — |
| | 1,086 |
| | — |
| | — |
| | — |
| | 1,086 |
|
Net income | — |
| | — |
| | — |
| | 230 |
| | — |
| | — |
| | — |
| | 230 |
|
Net transfers to parent | — |
| | — |
| | — |
| | (59 | ) | | — |
| | — |
| | — |
| | (59 | ) |
Other comprehensive income | — |
| | — |
| | — |
| | — |
| | — |
| | — |
| | 5 |
| | 5 |
|
Balance as of December 31, 2017 | — |
| | — |
| | — |
| | 1,257 |
| | — |
| | — |
| | 5 |
| | 1,262 |
|
Net income | — |
| | — |
| | — |
| | 43 |
| | — |
| | 119 |
| | — |
| | 162 |
|
Other comprehensive loss | — |
| | — |
| | — |
| | — |
| | — |
| | — |
| | (13 | ) | | (13 | ) |
Net transfer to and net contribution from former Parent | — |
| | — |
| | — |
| | 222 |
| | — |
| | — |
| | — |
| | 222 |
|
Cumulative effect of change in accounting standard | — |
| | — |
| | — |
| | (15 | ) | | — |
| | — |
| | — |
| | (15 | ) |
Dividends | — |
| | — |
| | — |
| | (25 | ) | | — |
| | (50 | ) | | — |
| | (75 | ) |
Transfer of net investment to additional paid-in capital | — |
| | — |
| | — |
| | (1,482 | ) | | 1,482 |
| | — |
| | — |
| | — |
|
Issuance of common stock | 100 |
| | 1 |
| | — |
| | — |
| | — |
| | — |
| | — |
| | 1 |
|
Net share settlement of incentive equity awards | — |
| | — |
| | — |
| | — |
| | (34 | ) | | — |
| | — |
| | (34 | ) |
Repurchase of common stock | (2 | ) | | — |
| | (119 | ) | | — |
| | — |
| | — |
| | — |
| | (119 | ) |
Change in deferred compensation | — |
| | — |
| | — |
| | — |
| | 26 |
| | — |
| | — |
| | 26 |
|
Other | — |
| | — |
| | — |
| | — |
| | 1 |
| | — |
| | — |
| | 1 |
|
Balance as of December 31, 2018 | 98 |
| | $ | 1 |
| | $ | (119 | ) | | $ | — |
| | $ | 1,475 |
| | $ | 69 |
| | $ | (8 | ) | | $ | 1,418 |
|
See Notes to Consolidated and Combined Financial Statements.
F-8
WYNDHAM HOTELS & RESORTS, INC.
NOTES TO CONSOLIDATED AND COMBINED FINANCIAL STATEMENTS
(Unless otherwise noted, all amounts are in millions, except share and per share amounts)
Wyndham Hotels & Resorts, Inc. (“Wyndham Hotels” or the “Company”) is a leading global hotel franchisor, licensing its renowned hotel brands to hotel owners in more than 80 countries around the world. Prior to May 31, 2018, the Company was wholly owned by Wyndham Worldwide Corporation (‘‘Wyndham Worldwide’’, “Wyndham Destinations” and, collectively with its consolidated subsidiaries, ‘‘former Parent’’).
In May 2018, the Wyndham Worldwide board of directors approved the spin-off of its hotel franchising and management businesses (“Wyndham Hotels & Resorts Businesses”) through a pro-rata distribution of all of the outstanding shares of Wyndham Hotels & Resorts, Inc.’s common stock to Wyndham Worldwide stockholders (the “Distribution”). Pursuant to the Distribution, on May 31, 2018, Wyndham Worldwide stockholders received one share of Wyndham Hotels & Resorts, Inc.’s common stock for each share of Wyndham Worldwide common stock held as of the close of business on May 18, 2018. In conjunction with the Distribution, Wyndham Hotels & Resorts, Inc. underwent an internal reorganization following which it became the holder, directly or through its subsidiaries, of the Wyndham Hotels & Resorts Businesses. Also in conjunction with the Distribution, Wyndham Worldwide Corporation was renamed Wyndham Destinations, Inc.
The Consolidated and Combined Financial Statements have been prepared on a stand-alone basis and prior to May 31, 2018 are derived from the consolidated financial statements and accounting records of Wyndham Worldwide. The Consolidated and Combined Financial statements include Wyndham Hotels’ assets, liabilities, revenues, expenses and cash flows and all entities in which Wyndham Hotels has a controlling financial interest. The accompanying Consolidated and Combined Financial Statements have been prepared in accordance with accounting principles generally accepted in the United States of America. All intercompany balances and transactions have been eliminated in the Consolidated and Combined Financial Statements.
Wyndham Hotels’ Combined Financial Statements prior to May 31, 2018, include certain indirect general and administrative costs allocated to it by former Parent for certain functions and services including, but not limited to, executive office, finance and other administrative support. These expenses were allocated to Wyndham Hotels on the basis of direct usage when identifiable, with the remainder allocated primarily based on its pro-rata share of combined revenues or headcount. Both Wyndham Hotels and former Parent considered the basis on which expenses prior to spin-off had been allocated to be a reasonable reflection of the utilization of services provided to or the benefit received by Wyndham Hotels during the periods presented.
In presenting the Consolidated and Combined Financial Statements, management makes estimates and assumptions that affect the amounts reported and related disclosures. Estimates, by their nature, are based on judgment and available information. Accordingly, actual results could differ from those estimates. In management’s opinion, the Consolidated and Combined Financial Statements contain all normal recurring adjustments necessary for a fair presentation of annual results reported.
Business Description
Wyndham Hotels operates in the following segments:
| |
• | Hotel franchising — licenses the Company’s lodging brands and provides related services to third-party hotel owners and others. |
| |
• | Hotel management — provides hotel management services for full-service and limited-service hotels as well as two hotels that are owned by the Company. |
| |
2. | Summary of Significant Accounting Policies |
Principles of Consolidation
When evaluating an entity for consolidation, the Company first determines whether an entity is within the scope of the guidance for consolidation of variable interest entities (“VIEs”) and if it is deemed to be a VIE. If the entity is considered to be a VIE, Wyndham Hotels determines whether it would be considered the entity’s primary beneficiary. The Company consolidates those VIEs for which it has determined that it is the primary beneficiary. Wyndham Hotels will consolidate an
entity not deemed a VIE upon a determination that it has a controlling financial interest. For entities where Wyndham Hotels does not have a controlling financial interest, the investments in such entities are classified as available-for-sale securities or accounted for using the equity or cost method, as appropriate.
Use of Estimates and Assumptions
The preparation of the Consolidated and Combined Financial Statements requires Wyndham Hotels to make estimates and assumptions that affect the reported amounts of assets, liabilities, revenues and expenses and the disclosure of contingent assets and liabilities in the Consolidated and Combined Financial Statements and accompanying notes. Although these estimates and assumptions are based on Wyndham Hotels’ knowledge of current events and actions Wyndham Hotels may undertake in the future, actual results may ultimately differ from estimates and assumptions.
Revenue Recognition
The principal source of revenues from franchising hotels is ongoing royalty fees, which are typically a percentage of gross room revenues of each franchised hotel. For more detailed description of revenue recognition see Note 3 - Revenue Recognition.
Loyalty Programs
The Company operates the Wyndham Rewards and La Quinta Returns loyalty programs. Loyalty members accumulate points by staying in hotels operated under one of the Company’s brands. Wyndham Rewards members may also accumulate points by purchasing everyday services and products with their co-branded credit card.
The Company earns revenue from these programs (i) when a member stays at a participating hotel, club resort or vacation rental from a fee charged by Wyndham Hotels to the franchisee, which is based upon a percentage of room revenues generated from such stay which we recognize, net of redemptions, over time based upon loyalty point redemption patterns, including an estimate of loyalty points that will expire or will never be redeemed, and (ii) based upon a percentage of the member’s spending on the co-branded credit cards for which revenues are paid to Wyndham Hotels by a third-party issuing bank which we recognize over time based upon the redemption patterns of the loyalty points earned under the program, including an estimate of loyalty points that will expire or will never be redeemed.
As members earn points through the loyalty programs, the Company records a liability for the estimated future redemption costs, which is calculated based on (i) an estimated cost per point and (ii) an estimated redemption rate of the overall points earned, which is determined through historical experience, current trends and the use of an actuarial analysis.
The recorded liability related to these programs total $89 million and $60 million as of December 31, 2018 and 2017, respectively. The Company estimates the fair value of the future redemption obligations by projecting the timing of future point redemptions based on historical levels, including as estimate of the points that members will never redeem, and an estimate of the points members will eventually redeem.
Cash and Cash Equivalents
The Company considers highly-liquid investments purchased with an original maturity of three months or less to be cash equivalents.
Valuation of Accounts Receivable
The Company provides for estimated bad debts based on its assessment of the ultimate realizability of receivables, considering historical collection experience, the economic environment and specific customer information. When the Company determines that an account is not collectible, the account is written-off to the allowance for doubtful accounts. The following table illustrates the Company’s allowance for doubtful accounts activity for the year ended December 31:
|
| | | | | | | | | | | |
| 2018 | | 2017 | | 2016 |
Beginning Balance | $ | 61 |
| | $ | 77 |
| | $ | 98 |
|
Bad debt expense | 8 |
| | 7 |
| | 3 |
|
Write-offs | (17 | ) | | (23 | ) | | (24 | ) |
Ending Balance | $ | 52 |
| | $ | 61 |
| | $ | 77 |
|
Advertising Expense
Advertising costs are generally expensed in the period incurred. Advertising expenses, which are primarily recorded within marketing and reservation expenses on the Consolidated and Combined Statements of Income, were $92 million, $61 million and $77 million in 2018, 2017 and 2016, respectively.
Property and Equipment
Property and equipment (including leasehold improvements) are recorded at cost, and presented net of accumulated depreciation and amortization. Depreciation, recorded as a component of depreciation and amortization on the Consolidated and Combined Statements of Income, is computed utilizing the straight-line method over the lesser of the lease terms or estimated useful lives of the related assets. Amortization of leasehold improvements, also recorded as a component of depreciation and amortization, is computed utilizing the straight-line method over the lesser of the estimated benefit period of the related assets or the lease terms. Useful lives are generally 30 years for buildings, up to 20 years for building and leasehold improvements and from three to seven years for furniture, fixtures and equipment.
The Company capitalizes the costs of software developed for internal use in accordance with the guidance for accounting for costs of computer software developed or obtained for internal use. Capitalization of software developed for internal use commences during the development phase of the project. Wyndham Hotels amortizes software developed or obtained for internal use on a straight-line basis over its estimated useful life, which is generally three to five years. Such amortization commences when the software is substantially ready for its intended use.
The net carrying value of software developed or obtained for internal use was $69 million and $64 million as of December 31, 2018 and 2017, respectively.
Impairment of Long-Lived Assets
With regard to goodwill and other indefinite-lived intangible assets recorded in connection with business combinations, the Company annually (during the fourth quarter of each year subsequent to completing the Company’s annual forecasting process), or more frequently if circumstances indicate that the value of goodwill may be impaired, review the reporting units’ carrying values as required by the guidance for goodwill and other intangible assets. This is done either by performing a qualitative assessment or utilizing the two-step process, with an impairment being recognized only where the fair value is less than carrying value. In any given year, the Company can elect to perform a qualitative assessment to determine whether it is more likely than not that the fair value of a reporting unit is in excess of its carrying value. If it is not more likely than not that the fair value is in excess of the carrying value, or the Company elects to bypass the qualitative assessment, the Company would use the two-step process. The qualitative factors evaluated include macroeconomic conditions, industry and market considerations, cost factors, overall financial performance, its historical share price as well as other industry-specific considerations. The Company performed a quantitative assessment for impairment on each reporting unit’s goodwill for 2018. Based on the results of the Company’s quantitative assessments performed during the fourth quarter of 2018, the Company determined that no impairment existed, nor does the Company believe there is a material risk of it being impaired in the near term at its (i) hotel franchising, (ii) hotel management and (iii) owned hotel reporting units. To the extent estimated market-based valuation multiples and/or discounted cash flows are revised downward, the Company may be required to write-down all or a portion of goodwill, which would adversely impact earnings.
The Company also determines whether the carrying values of other indefinite-lived intangible assets are impaired on an annual basis or more frequently if indicators of potential impairment exist. Application of the other indefinite-lived intangible assets impairment test requires judgment in the assumptions underlying the approach used to determine fair value. The fair value of each other indefinite-lived intangible asset is estimated using a discounted cash flow methodology. This analysis requires significant judgments, including anticipated market conditions, operating expense trends, estimation of future cash flows, which are dependent on internal forecasts, and estimation of long-term rates of growth. The estimates used to calculate the fair value of other indefinite-lived intangible asset change from year to year based on operating results and market conditions. Changes in these estimates and assumptions could materially affect the determination of fair value and the other indefinite-lived intangible assets’ impairment.
The Company also evaluates the recoverability of its other long-lived assets, including property and equipment and amortizable intangible assets, if circumstances indicate impairment may have occurred, pursuant to guidance for impairment or disposal of long-lived assets. This analysis is performed by comparing the respective carrying values of the assets to the current and expected future cash flows, on an undiscounted basis, to be generated from such assets. Property and equipment are evaluated separately within each segment. If such analysis indicates that the carrying value of these assets is not recoverable, the carrying value of such assets is reduced to fair value.
Business Combinations
A component of the Company’s growth strategy has been to acquire and integrate businesses that complement its existing operations. The Company accounts for business combinations in accordance with the guidance for business combinations and related literature. Accordingly, the Company allocates the purchase price of acquired companies to the tangible and intangible assets acquired and liabilities assumed based upon their estimated fair values at the date of purchase. The difference between the purchase price and the fair value of the net assets acquired is recorded as goodwill.
In determining the fair values of assets acquired and liabilities assumed in a business combination, the Company uses various recognized valuation methods including present value modeling and referenced market values, where available. Further, the Company makes assumptions within certain valuation techniques including discount rates and timing of future cash flows. Valuations are performed by management or independent valuation specialists under management’s supervision, where appropriate. The Company believes that the estimated fair values assigned to the assets acquired and liabilities assumed are based on reasonable assumptions that marketplace participants would use. However, such assumptions are inherently uncertain and actual results could differ from those estimates.
Hotel Management Guarantees
The Company has entered into performance guarantees related to certain hotels that it manages. Upon the inception date of the guarantee, the Company records a performance liability that is measured at fair value. In order to estimate its fair value, the Company uses a weighted probability approach to determine the probability of possible outcomes. The valuation methodology requires that it make certain assumptions and judgments regarding discount rates, volatility and hotel operating results. The fair value is established at inception and is not revalued due to future changes in assumptions.
Certain of the Company’s performance guarantees have recapture provisions, which allow us to recover amounts funded under such guarantees. The Company records receivables for amounts expected to be recovered in the future. The Company makes certain assumptions and judgments regarding the recoverability of these receivables, which includes reviewing hotel operating results and current hotel net operating income projections.
Income Taxes
Prior to our spin-off, current and deferred income taxes and related tax expense have been determined based on Wyndham Hotels’ stand-alone results by applying a separate return methodology, as if the Wyndham Hotels entities were separate taxpayers in the respective jurisdictions. The Company recognizes deferred tax assets and liabilities based on the differences between the financial statement carrying amounts and the tax basis of assets and liabilities using currently enacted tax rates. The Company regularly reviews its deferred tax assets to assess their potential realization and establish a valuation allowance for portions of such assets that the Company believes will not be ultimately realized. In performing this review, the Company makes estimates and assumptions regarding projected future taxable income, the expected timing of the reversals of existing temporary differences and the implementation of tax planning strategies. A change in these assumptions may increase or decrease the Company’s valuation allowance resulting in an increase or decrease in its effective tax rate, which could materially impact the Company’s results of operations.
For tax positions the Company has taken or expect to take in a tax return, it applies a more likely than not threshold, under which the Company must conclude a tax position is more likely than not to be sustained, assuming that the position will be examined by the appropriate taxing authority that has full knowledge of all relevant information, in order to recognize or continue to recognize the benefit. In determining the Company’s provision for income taxes, the Company uses judgment, reflecting its estimates and assumptions, in applying the more likely than not threshold.
In January 2018, the Financial Accounting Standards Board (“FASB”) issued guidance on the accounting for tax on the global intangible low-taxed income provisions of the recently enacted tax law. These provisions impose a tax on foreign income in excess of a deemed return on tangible assets of foreign corporations. The guidance indicates that the Company is allowed to make an accounting policy choice of either: (1) treating taxes due on future inclusions in taxable income as a current-period expense when incurred or (2) factoring such amounts into the Company’s measurement of its deferred taxes. The Company has elected to account for any inclusions under the period cost method.
Stock-Based Compensation
In accordance with the guidance for stock-based compensation, Wyndham Hotels measures all employee stock-based compensation awards using a fair value method and records the related expense in its Consolidated and Combined Statements of Income.
Wyndham Hotels recognizes the cost of stock-based compensation awards to employees as they provide services and the expense is recognized ratably over the requisite service period. The requisite service period is the period during which an employee is required to provide services in exchange for an award. Forfeitures are recorded upon the actual employee termination for each outstanding grant.
Derivative Instruments
The Company uses derivative instruments as part of its overall strategy to manage its exposure to market risks primarily associated with fluctuations in currency exchange rates and interest rates. As a matter of policy, the Company does not use derivatives for trading or speculative purposes. All derivatives are recorded at fair value as either assets or liabilities. Changes in fair value of derivatives not designated as hedging instruments and of derivatives designated as fair value hedging instruments are recognized currently in operating income and net interest expense in the Consolidated and Combined Statements of Income, based upon the nature of the hedged item. The effective portion of changes in fair value of derivatives designated as cash flow hedging instruments is recorded as a component of other comprehensive income. The ineffective portion is reported immediately in earnings as a component of operating expense, based upon the nature of the hedged item. Amounts included in other comprehensive income are reclassified into earnings in the same period during which the hedged item affects earnings.
Accumulated Other Comprehensive Income (Loss)
Accumulated other comprehensive income (“AOCI”) consists of accumulated foreign currency translation adjustments and unrealized gains or losses on our cash flow hedges. Foreign currency translation adjustments exclude income taxes related to indefinite investments in foreign subsidiaries. Assets and liabilities of foreign subsidiaries having non-U.S.-dollar functional currencies are translated at exchange rates at the balance sheet dates. Revenues and expenses are translated at average exchange rates during the periods presented. The gains or losses resulting from translating foreign currency financial statements into U.S. dollars, net of hedging gains or losses and taxes, are included in AOCI on the Consolidated and Combined Balance Sheets. Accumulated foreign currency translation adjustments included in AOCI were a loss of $4 million ($4 million net of taxes) and a gain of $6 million ($5 million, net of taxes) as of December 31, 2018 and 2017, respectively. Cash flow hedge losses included in AOCI were losses of $5 million ($4 million, net of taxes) as of December 31, 2018. There were no cash flow hedge gains or losses included in AOCI as of December 31, 2017.
Former Parent’s Net Investment
Parent’s net investment in the Consolidated and Combined Balance Sheets represents Wyndham Worldwide’s historical net investment in Wyndham Hotels resulting from various transactions with and allocations from the former Parent. Balances due to and due from the former Parent and accumulated earnings attributable to Wyndham Hotels operations have been presented as components of former Parent’s net investment. Cash presented in the Consolidated and Combined Balance Sheets represents cash that had not yet been transferred to the former Parent.
Recently Issued Accounting Pronouncements
Leases. In February 2016, the FASB issued guidance which requires companies generally to recognize on the balance sheet operating and financing lease liabilities and corresponding right-of-use assets. This guidance is effective for fiscal years beginning after December 15, 2018 and for interim periods within those fiscal years, with early adoption permitted. The Company will adopt the guidance on January 1, 2019, as required, using the modified retrospective method. The Company currently estimates such adoption will result in the recognition of an operating right-of use asset and operating lease liability of approximately $12 million.
Simplifying the Test for Goodwill Impairment. In January 2017, the FASB issued guidance which simplifies the current two-step goodwill impairment test by eliminating Step 2 of the test. The guidance requires a one-step impairment test in which an entity compares the fair value of a reporting unit with its carrying amount and recognizes an impairment charge for the amount by which the carrying amount exceeds the reporting unit’s fair value, if any. This guidance is effective for fiscal years beginning after December 15, 2019 and interim periods within those fiscal years, and should be applied on a prospective basis. Early adoption is permitted for the interim or annual goodwill impairment tests performed on testing dates after January 1, 2017. The Company is currently evaluating the impact of the adoption of this guidance on its financial statements and related disclosures.
Reclassification of Certain Tax Effects from Accumulated Other Comprehensive Income. In January 2017, the FASB issued guidance which permits entities to reclassify tax effects stranded in accumulated other comprehensive income to retained earnings for stranded tax effects resulting from the Tax Cuts and Jobs Act. This new guidance is effective for annual and interim periods in fiscal years beginning after December 15, 2018. Early adoption is permitted in annual and interim periods and can be applied retrospectively or in the period of adoption. The Company will adopt the guidance on January 1, 2019, as required, and it believes the adoption of this guidance will not have a material impact on its financial statements and related disclosures.
Customer’s Accounting for Implementation Costs Incurred in a Cloud Computing Arrangement That Is a Service Contract. In August 2018, the FASB issued guidance to address a customer’s accounting for implementation costs incurred in a cloud computing arrangement that is a service contract. The guidance aligns the requirements for capitalizing implementation costs incurred in such arrangements with the requirements for capitalizing implementation costs incurred to develop or obtain internal-use software. This guidance is effective for fiscal years beginning after December 15, 2019 and for interim periods within those fiscal years, with early adoption permitted. This guidance should be applied on either a retrospective or prospective basis. The Company is currently evaluating the impact of the adoption of this guidance on its financial statements and related disclosures.
Recently Adopted Accounting Pronouncements
Revenue from Contracts with Customers. In May 2014, the FASB issued guidance on revenue from contracts with customers. The guidance outlines a single comprehensive model for entities to use in accounting for revenue arising from contracts with customers. The guidance also requires disclosures regarding the nature, amount, timing and uncertainty of revenue and cash flows arising from contracts with customers. Entities had the option to apply the new guidance under a retrospective approach to each prior reporting period presented or a modified retrospective approach with the cumulative effect of initially applying the new guidance recognized at the date of initial application within the statement of financial position. The Company adopted the guidance on January 1, 2018 utilizing the full retrospective transition method.
This adoption primarily affected the accounting for initial franchise fees, upfront costs, marketing and reservation expenses and loyalty revenues. Specifically, under the new guidance, initial fees are recognized ratably over the life of the noncancelable period of the franchise agreement, and incremental upfront contract costs are deferred and expensed over the life of the noncancelable period of the franchise agreement. Loyalty revenues are deferred and primarily recognized over the loyalty points’ redemption pattern. Additionally, the Company no longer accrues a liability for future marketing and reservation costs when marketing and reservation revenues earned exceed costs incurred. Marketing and reservation costs incurred in excess of revenues earned continue to be expensed as incurred.
The tables below summarize the impact of the adoption of the new revenue standard on the Company’s Consolidated and Combined Income Statements:
|
| | | | | | | | | | | | | | | | | | | | | | | |
| Year Ended December 31, 2017 | | Year Ended December 31, 2016 |
Net revenues | Previously Reported Balance | | New Revenue Standard
Adjustments | | Adjusted Balance | | Previously Reported Balance | | New Revenue Standard
Adjustments | | Adjusted Balance |
Royalties and franchise fees | $ | 375 |
| | $ | (11 | ) | | $ | 364 |
| | $ | 353 |
| | $ | 1 |
| | $ | 354 |
|
Marketing, reservation and loyalty | 407 |
| | (36 | ) | | 371 |
| | 405 |
| | (30 | ) | | 375 |
|
Other | 118 |
| | (20 | ) | | 98 |
| | 111 |
| | (14 | ) | | 97 |
|
Net revenues | 1,347 |
| | (67 | ) | | 1,280 |
| | 1,312 |
| | (43 | ) | | 1,269 |
|
| | | | | | | | | | | |
Expenses | | | | | | | | | | | |
Marketing, reservation and loyalty | 406 |
| | (33 | ) | | 373 |
| | 407 |
| | (31 | ) | | 376 |
|
Operating | 205 |
| | (22 | ) | | 183 |
| | 187 |
| | (19 | ) | | 168 |
|
Total expenses | 1,086 |
| | (55 | ) | | 1,031 |
| | 1,024 |
| | (50 | ) | | 974 |
|
| | | | | | | | | | | |
Income/(loss) before income taxes | 255 |
| | (12 | ) | (a) | 243 |
| | 287 |
| | 7 |
| | 294 |
|
Provision for income taxes | 12 |
| | 1 |
| (a) | 13 |
| | 115 |
| | 3 |
| | 118 |
|
Net income/(loss) | 243 |
| | (13 | ) | | 230 |
| | 172 |
| | 4 |
| | 176 |
|
______________________
| |
(a) | The income tax provision for 2017 consists of (i) a $4 million deferred tax provision resulting from a reduction in deferred tax assets recorded in connection with the retrospective adoption of the new revenue standard and the impact of the lower U.S. corporate income tax rate from the enactment of the U.S. Tax Cuts and Jobs Act and (ii) a $3 million tax benefit related to the $12 million loss before income taxes. |
The table below summarizes the impact of the adoption of the new revenue standard on the Company’s Consolidated and Combined Balance Sheet:
|
| | | | | | | | | | | |
| At December 31, 2017 |
Assets | Previously Reported Balance | | New Revenue Standard
Adjustments | | Adjusted Balance |
Other current assets | $ | 50 |
| | $ | 4 |
| | $ | 54 |
|
Total current assets | 330 |
| | 4 |
| | 334 |
|
Other non-current assets | 176 |
| | 11 |
| | 187 |
|
Total assets | 2,122 |
| | 15 |
| | 2,137 |
|
| | | | | |
Liabilities and net investment | | | | | |
Deferred income (current) | 79 |
| | 5 |
| | 84 |
|
Total current liabilities | 406 |
| | 5 |
| | 411 |
|
Deferred income taxes | 181 |
| | (8 | ) | | 173 |
|
Deferred income (non-current) | 76 |
| | 88 |
| | 164 |
|
Other non-current liabilities | 78 |
| | (32 | ) | | 46 |
|
Total liabilities | 822 |
| | 53 |
| | 875 |
|
Former Parent’s net investment | 1,295 |
| | (38 | ) | | 1,257 |
|
Total liabilities and net investment | 2,122 |
| | 15 |
| | 2,137 |
|
In addition, the cumulative impact from the adoption of the new revenue standard to the Company’s former Parent’s net investment at January 1, 2016, was a decrease of $29 million.
Intra-Entity Transfers of Assets Other Than Inventory. In October 2016, the FASB issued guidance which requires companies to recognize the income tax consequences of an intra-entity transfer of an asset other than inventory when the transfer occurs. This guidance requires the modified retrospective approach and is effective for fiscal years beginning after December 15, 2017, including interim periods within those fiscal years. The Company adopted the guidance on January 1, 2018, as required, which resulted in a cumulative-effect benefit to retained earnings of $15 million.
Clarifying the Definition of a Business. In January 2017, the FASB issued guidance clarifying the definition of a business, which assists entities when evaluating whether transactions should be accounted for as acquisitions of businesses or of assets. This guidance is effective on a prospective basis for fiscal years beginning after December 15, 2017, including interim periods within those fiscal years. The Company adopted the guidance on January 1, 2018, as required. There was no material impact on its Consolidated and Combined Financial Statements and related disclosures.
Compensation - Stock Compensation. In May 2017, the FASB issued guidance which provides clarification on when modification accounting should be used for changes to the terms or conditions of a share-based payment award. This guidance is effective for fiscal years beginning after December 15, 2017 and for interim periods within those fiscal years. The Company adopted the guidance on January 1, 2018, as required. There was no material impact on its Consolidated and Combined Financial Statements and related disclosures.
Statement of Cash Flows. In August 2016, the FASB issued guidance intended to reduce diversity in practice in how certain transactions are classified in the statement of cash flows. This guidance requires the retrospective transition method and is effective for fiscal years beginning after December 15, 2017, including interim periods within those fiscal years. The Company adopted the guidance on January 1, 2018, as required. The impact of this new guidance resulted in payments of, and proceeds from, development advance notes being recorded within operating activities on its Consolidated and Combined Statements of Cash Flows. Such amounts were previously reported within investing activities.
Restricted Cash. In November 2016, the FASB issued guidance which requires amounts generally described as restricted cash be included with cash and cash equivalents when reconciling the total beginning and ending amounts for the periods shown on the statement of cash flows. This guidance is effective for fiscal years beginning after December 15, 2017, including interim periods within those fiscal years. The Company adopted the guidance on January 1, 2018, as required, using a retrospective transition method. The impact of this guidance resulted in restricted cash being included with cash, cash equivalents and restricted cash on the Consolidated and Combined Statements of Cash Flows. As of December 31, 2018, there was no restricted cash. As of December 31, 2017, total cash, cash equivalents and restricted cash was $59 million, comprised of $57 million of cash and cash equivalents and $2 million of restricted cash, which is included within other current assets on the Consolidated and Combined Balance Sheet.
Derivatives and Hedging - Targeted Improvements to Accounting for Hedging Activities. In August 2017, the FASB issued guidance intended to better align an entity’s risk management activities and financial reporting for hedging relationships through changes to both the designation and measurement guidance for qualifying hedging relationships and the presentation of hedge results. The guidance will expand and refine hedge accounting for both nonfinancial and financial risk components and align the recognition and presentation of the effects of the hedging instrument and the hedged item in the financial statements. This guidance is effective for fiscal years beginning after December 15, 2018 and for interim periods within those fiscal years, with early adoption permitted. The Company early adopted the guidance on April 1, 2018 and there was no material impact on its Consolidated and Combined Financial Statements and related disclosures.
The principal source of revenues from franchising hotels is ongoing royalty fees, which are typically a percentage of gross room revenues of each franchised hotel. The Company recognizes royalty fee revenues as and when the underlying sales occur. The Company also receives non-refundable initial franchise fees, which are recognized as revenues over the initial non-cancellable period of the franchise agreement, commencing when all material services or conditions have been substantially performed. This occurs when a franchised hotel opens for business or when a franchise agreement is terminated after it has been determined that the franchised hotel will not open.
The Company’s franchise agreements also require the payment of marketing and reservation fees, which are intended to reimburse the Company for expenses associated with operating an international, centralized reservation system, e-commerce channels such as the Company’s brand.com websites, as well as access to third-party distribution channels, such as online travel agents, advertising and marketing programs, global sales efforts, operations support, training and other related services. Marketing and reservation fees are recognized as revenue when the underlying sales occur. Although the Company is
generally contractually obligated to spend the marketing and reservation fees it collects from franchisees, in accordance with the franchise agreements, marketing and reservations costs are expensed as incurred.
The Company earns revenues from its Wyndham Rewards loyalty program when a member stays at a participating hotel, club resort or vacation rental. These revenues are derived from a fee the Company charges a franchised or managed hotel based upon a percentage of room revenues generated from a Wyndham Rewards member’s stay. These fees are to reimburse the Company for expenses associated with member redemptions and activities that are related to the administering and marketing of the program. Revenues related to the loyalty program represent variable consideration and are recognized net of redemptions over time based upon loyalty point redemption patterns, which include an estimate of loyalty points that will expire or will never be redeemed.
The Company earns revenue from its Wyndham Rewards co-branded credit card program, which is primarily generated by cardholder spending and the enrollment of new cardholders. The advance payments received under the program are recognized as a contract liability. The program primarily contains two performance obligations: (i) brand performance services, for which revenue is recognized over the contract term on a straight-line basis, and (ii) issuance and redemption of loyalty points, for which revenue is recognized over time based upon the redemption patterns of the loyalty points earned under the program, including an estimate of loyalty points that will expire or will never be redeemed.
The Company provides management services for hotels under management contracts, which offer hotel owners all the benefits of a global brand and a full range of management, marketing and reservation services. In addition to the standard franchise services described above, the Company’s hotel management business provides hotel owners with professional oversight and comprehensive operations support services. The Company’s standard management agreement typically has a term of up to 25 years. The Company’s management fees are comprised of base fees, which are typically a specified percentage of gross revenues from hotel operations, and, in some cases, incentive fees, which are typically a specified percentage of a hotel’s gross operating profit. The base fees are recognized when the underlying sales occur and the management services are performed. Incentive fees are recognized when determinable, which is when the Company has met hotel operating performance metrics and the Company has determined that a significant reversal of revenues recognized will not occur.
The Company also recognizes reimbursable payroll costs for operational employees and other reimbursable costs at certain of the Company’s managed hotels as revenue. Although these costs are funded by hotel owners, accounting guidance requires the Company to report these fees on a gross basis as both revenues and expenses. Additionally, the Company recognizes occupancy taxes on a net basis.
The Company recognizes license and other revenues from Wyndham Destinations for use of the “Wyndham” trademark and certain other trademarks.
In addition, the Company earns revenues from its two owned hotels, which consist primarily of (i) gross room rentals, (ii) food and beverage services and (iii) on-site spa, casino, golf and shop revenues. These revenues are recognized upon the completion of services.
Contract Liabilities
Contract liabilities generally represent payments or consideration received in advance for goods or services that the Company has not yet provided to the customer. Contract liabilities as of December 31, 2018 and December 31, 2017 are as follows:
|
| | | | | | | | |
| | December 31, 2018 | | December 31, 2017 |
Deferred initial franchise fee revenue | | $ | 127 |
| | $ | 116 |
|
Deferred loyalty program revenue | | 74 |
| | 54 |
|
Deferred co-branded credit card programs revenue | | 30 |
| | 37 |
|
Deferred hotel management fee revenue | | 21 |
| | 19 |
|
Deferred other revenue | | 21 |
| | 22 |
|
Total | | $ | 273 |
| | $ | 248 |
|
Deferred initial franchise fees represent payments received in advance from prospective franchisees upon the signing of a franchise agreement and are generally recognized to revenue within 12 years. Deferred loyalty revenues represent the portion of loyalty program fees charged to franchisees, net of redemption costs, which have been deferred and will be recognized over time based upon loyalty point redemption patterns. Deferred co-branded credit card program revenue represents payments received in advance from the Company’s co-branded credit card partners primarily for card member activity, which is typically recognized within one year.
Capitalized Contract Costs
The Company incurs certain direct and incremental sales commissions costs in order to obtain hotel franchise and management contracts. Such costs are capitalized and subsequently amortized beginning upon hotel opening over the first non-cancellable period of the agreement. In the event an agreement is terminated prior to the end of the first non-cancellable period, any unamortized cost is immediately expensed. As of December 31, 2018 and December 31, 2017, capitalized contract costs were $24 million and $26 million, respectively.
Practical Expedients
The Company has not adjusted the consideration for the effects of a significant financing component if it expects, at contract inception, that the period between when the Company satisfied the performance obligation and when the customer paid for that good or service was one year or less.
For contracts with customers that were modified before the beginning of the earliest reporting period presented, the Company did not retrospectively restate the revenue associated with the contract for those modifications. Instead, it reflected the aggregate effect of all prior modifications in determining (i) the performance obligations and transaction prices and (ii) the allocation of such transaction prices to the performance obligations.
Performance Obligations
A performance obligation is a promise in a contract with a customer to transfer a distinct good or service to the customer. The consideration received from a customer is allocated to each distinct performance obligation and recognized as revenue when, or as, each performance obligation is satisfied. The following table summarizes the Company’s remaining performance obligations for the years set forth below:
|
| | | | | | | | | | | | | | | | | | | |
| 2019 | | 2020 | | 2021 | | Thereafter | | Total |
Initial franchise fee revenue | $ | 18 |
| | $ | 9 |
| | $ | 8 |
| | $ | 92 |
| | $ | 127 |
|
Loyalty program revenue | 46 |
| | 19 |
| | 7 |
| | 2 |
| | 74 |
|
Co-branded credit card programs revenue | 30 |
| | — |
| | — |
| | — |
| | 30 |
|
Hotel management fee revenue | — |
| | — |
| | 1 |
| | 20 |
| | 21 |
|
Other revenue | 15 |
| | 1 |
| | 1 |
| | 4 |
| | 21 |
|
Total | $ | 109 |
|
| $ | 29 |
|
| $ | 17 |
|
| $ | 118 |
|
| $ | 273 |
|
Disaggregation of Net Revenues
The table below presents a disaggregation of the Company’s net revenues from contracts with customers by major services and products for each of the Company’s segments:
|
| | | | | | | | | | | |
| 2018 | | 2017 | | 2016 |
Hotel Franchising | | | | | |
Royalties and franchise fees | $ | 432 |
| | $ | 355 |
| | $ | 347 |
|
Marketing, reservation and loyalty | 489 |
| | 369 |
| | 373 |
|
License and other revenues from former Parent | 111 |
| | 75 |
| | 65 |
|
Other | 103 |
| | 98 |
| | 96 |
|
Total Hotel Franchising | 1,135 |
| | 897 |
| | 881 |
|
| | | | | |
Hotel Management | | | | | |
Royalties and franchise fees | 9 |
| | 9 |
| | 7 |
|
Marketing, reservation and loyalty | 2 |
| | 2 |
| | 2 |
|
Hotel management - owned properties | 75 |
| | 78 |
| | 81 |
|
Hotel management - managed properties | 49 |
| | 30 |
| | 26 |
|
Cost reimbursements | 586 |
| | 264 |
| | 271 |
|
Other | 5 |
| | — |
| | 1 |
|
Total Hotel Management | 726 |
| | 383 |
| | 388 |
|
| | | | | |
Corporate and Other | 7 |
| | — |
| | — |
|
| | | | | |
Net Revenues | $ | 1,868 |
| | $ | 1,280 |
| | $ | 1,269 |
|
The computation of basic and diluted earnings per share (“EPS”) is based on net income divided by the basic weighted average number of common shares and diluted weighted average number of common shares, respectively. On June 1, 2018, the Company’s separation from Wyndham Worldwide was effected through a tax-free distribution to Wyndham Worldwide’s stockholders of one share of the Company’s common stock for every one share of Wyndham Worldwide common stock held as of the close of business on May 18, 2018. As a result, on June 1, 2018, the Company had 99.8 million shares of common stock outstanding (inclusive of deferred shares and shares that vested upon separation). This share amount is being utilized for the calculation of basic and diluted earnings per share for all periods presented prior to the date of separation.
The following table sets forth the computation of basic and diluted EPS (in millions, except per-share data):
|
| | | | | | | | | | | |
| 2018 | | 2017 | | 2016 |
Net income | $ | 162 |
| | $ | 230 |
| | $ | 176 |
|
| | | | | |
Basic weighted average shares outstanding | 99.5 |
| | 99.8 |
| | 99.8 |
|
Stock options and restricted stock units (“RSUs”) | 0.3 |
| | — |
| | — |
|
Diluted weighted average shares outstanding | 99.8 |
| | 99.8 |
| | 99.8 |
|
| | | | | |
Earnings per share: | | | | | |
Basic | $ | 1.62 |
| | $ | 2.31 |
| | $ | 1.76 |
|
Diluted | 1.62 |
| | 2.31 |
| | 1.76 |
|
| | | | | |
Dividends: | | | | | |
Cash dividends declared per share | $ | 0.75 |
| | $ | — |
| | $ | — |
|
Aggregate dividends paid to shareholders | $ | 77 |
| | $ | — |
| | $ | — |
|
Stock Repurchase Program
On May 9, 2018, the Company’s Board of Directors approved a stock repurchase program, which became effective immediately following the Distribution, under which it is authorized to repurchase up to $300 million of its outstanding common stock.
The following table summarizes stock repurchase activity under this stock repurchase program (in millions, except per share data):
|
| | | | | | | | | | |
| Shares | | Cost | | Average Price Per Share |
As of May 31, 2018 | — |
| | $ | — |
| | $ | — |
|
For the seven months ended December 31, 2018 | 2.3 |
| | 119 |
| | 52.51 |
|
As of December 31, 2018 | 2.3 |
| | $ | 119 |
| | $ | 52.51 |
|
The Company had $181 million of remaining availability under its program as of December 31, 2018.
Assets acquired and liabilities assumed in business combinations were recorded on the Consolidated and Combined Balance Sheets as of the respective acquisition dates based upon their estimated fair values at such dates. The results of operations of businesses acquired by the Company have been included in the Consolidated and Combined Statements of Income since their respective dates of acquisition. The excess of the purchase price over the estimated fair values of the underlying assets acquired and liabilities assumed was allocated to goodwill. In certain circumstances, the allocations of the excess purchase price are based upon preliminary estimates and assumptions. Accordingly, the allocations may be subject to revision when the Company receives final information, including appraisals and other analyses. Any revisions to the fair values during the allocation period will be recorded by the Company as further adjustments to the purchase price allocations. Although, in certain circumstances, the Company has substantially integrated the operations of its acquired businesses, additional future costs relating to such integration may occur. These costs may result from integrating operating systems, relocating employees, closing facilities, reducing duplicative efforts and exiting and consolidating other activities. These costs will be recorded on the Consolidated and Combined Statements of Income as expenses.
The La Quinta Acquisition
On May 30, 2018, the Company completed its acquisition of La Quinta Holdings Inc.’s hotel franchising and hotel management business (“La Quinta”) for $1.95 billion in cash, which includes $8 million of purchase price that the Company withheld to pay La Quinta employee-related equity award liabilities and $240 million of purchase price that the Company withheld to pay La Quinta tax liabilities, as discussed below. The addition of La Quinta’s over 900 franchised hotels and nearly 89,000 rooms increased Wyndham Hotels’ midscale presence and expanded its reach further into the upper-midscale segment of the lodging industry. In addition, this transaction expanded the Company’s number of managed hotel properties from 116 to 440. This acquisition will strengthen the Company’s position in the midscale and upper-midscale segments of the hotel industry, which has been and continues to be one of the Company’s strategic priorities.
In conjunction with the acquisition, stockholders of La Quinta Holdings received $16.80 per share in cash (approximately $1.0 billion in aggregate), and Wyndham Hotels repaid approximately $715 million of La Quinta Holdings’ debt and withheld cash of $240 million for estimated taxes assumed and expected to be incurred in connection with the taxable spin-off of La Quinta Holdings’ owned real estate assets into CorePoint Lodging, Inc. (“CorePoint”), which occurred immediately prior to the acquisition of La Quinta. Wyndham Hotels financed the $1.95 billion acquisition with proceeds from its $500 million offering of 5.375% senior notes due 2026 completed in April 2018 and a $1.6 billion term loan due 2025 that closed in connection with the acquisition.
The preliminary allocation of the purchase price is summarized as follows:
|
| | | | | | | |
| | | Amount |
Total consideration (a) | | | $ | 1,951 |
|
Cash withheld to repay La Quinta Holdings Inc.’s estimated tax liability (b) | | | (240 | ) |
Cash withheld to pay employee-related equity award liabilities | | | (8 | ) |
Net cash consideration | | | 1,703 |
|
| | | |
Cash escrowed from CorePoint (c) | $ | 985 |
| | |
Payment of La Quinta Holdings Inc.’s long‑term debt (c) | (985 | ) | | |
| — |
| | — |
|
Cash utilized to repay La Quinta Holdings Inc.’s long‑term debt (d) | | | (715 | ) |
Net cash consideration (to shareholders of La Quinta Holdings Inc.) | | | $ | 988 |
|
| | | |
Total current assets (e) | | | $ | 69 |
|
Property and equipment | | | 17 |
|
Trademarks (f) | | | 710 |
|
Franchise agreements (f) | | | 260 |
|
Management contracts (f) | | | 119 |
|
Other assets | | | 5 |
|
Total assets acquired | | | $ | 1,180 |
|
| | | |
Total current liabilities (e) | | | $ | 105 |
|
Deferred income taxes (g) | | | 248 |
|
Long‑term debt repaid at acquisition (c) | | | 715 |
|
Assumed tax liability (b) | | | 240 |
|
Other liabilities | | | 11 |
|
Total liabilities assumed | | | 1,319 |
|
Net identifiable liabilities acquired | | | (139 | ) |
Goodwill (h) | | | 1,127 |
|
Total consideration transferred | | | $ | 988 |
|
______________________
(a) Includes additional consideration of $1 million related to a net debt adjustment paid to CorePoint during the third quarter of 2018.
| |
(b) | Reflects a portion of the purchase price which is expected to be paid by early 2019 to tax authorities and/or CorePoint. During the third quarter of 2018, the Company paid $35 million related to this liability. As such, the balance at December 31, 2018 was $205 million, which is reported within Accrued expenses and other current liabilities on the Consolidated and Combined Balance Sheet. |
| |
(c) | As a result of a change in control provision within La Quinta’s long-term indebtedness, CorePoint deposited $985 million into an escrow account which was utilized to repay a portion of La Quinta Holdings Inc.’s existing indebtedness. |
(d) Reflects the portion of La Quinta Holdings Inc.’s long-term debt that was required to be paid by the Company upon a change in control.
(e) The fair values of total current assets and total current liabilities are estimated to approximate their current carrying values.
| |
(f) | The identifiable intangible assets consist of trademarks with an indefinite life, franchise agreements which have a weighted average life of 25 years and management agreements which have a weighted average life of 15 years. The preliminary fair valuation was performed with the assistance of a third‑party valuation firm, which included the consideration of various valuation techniques that the Company deems appropriate for the measurement of fair value of the assets acquired and liabilities assumed. |
The valuations of the franchise agreements and management agreements are based on a discounted cash flow method utilizing forecasted cash flows from La Quinta’s existing franchise agreements and CorePoint franchise agreements and management agreements (the “CorePoint agreements”) that are estimated to be generated over the estimated terms of such contracts. The expected cash flows projections were based on the terms of the agreements, and adjusted for inflation and the costs and expenses required to generate the revenues under such agreements.
The significant assumptions that were utilized for La Quinta’s franchise agreements were: (i) forecasted gross room revenues, (ii) a franchise fee of 4.5%, tax affected, and (iii) a discount rate of 9.5%.
The significant assumptions that were utilized for the CorePoint agreements were: (i) forecasted gross room revenues, (ii) franchise and management fee rates of 5.0% each, which were tax affected, and (iii) a discount rate of 9.5% and 10.5% for CorePoint franchise and management agreements, respectively.
| |
(g) | The deferred tax liability primarily results from the fair value adjustments for the identifiable intangible assets. This estimate of deferred tax liabilities was determined based on the book and tax basis differences attributable to the identifiable intangible assets acquired at a combined federal and state effective tax rate. |
(h) The goodwill recognized in the La Quinta acquisition is not expected to be deductible for income tax purposes.
La Quinta’s incremental contributions to Net revenues and Operating income for the three months ended December 31, 2018 were $198 million and $29 million, respectively. Pro forma Net revenues and Operating income would have been $2,221 million and $294 million, respectively, during the year ended December 31, 2018, if La Quinta’s historical results had
been included in the Company’s Consolidated and Combined Statements of Income since January 1, 2018. For 2017, pro forma Net revenues and Net income would have been $2,041 million and $263 million, respectively. This acquisition was assigned to the Company’s Hotel Franchising and Hotel Management segments.
The AmericInn Acquisition
During October 2017, the Company completed the acquisition of the AmericInn hotel brand and franchise system for a total purchase price of $140 million, net of cash acquired which included a simultaneous sale of 10 owned hotels to an unrelated third party for $28 million. AmericInn’s portfolio consists of 200 franchised hotels predominantly in the Midwestern United States. This acquisition is consistent with the Company’s strategy to expand its brand portfolio and total system size.
The following table summarizes the fair value of the assets acquired and liabilities assumed in connection with Wyndham Hotels’ acquisition of AmericInn:
|
| | | |
| Amount |
Trade receivables | $ | 3 |
|
Goodwill (a) | 44 |
|
Franchise agreements (b) | 46 |
|
Trademarks | 51 |
|
Total assets acquired | 144 |
|
Other current liabilities | 4 |
|
Total liabilities acquired | 4 |
|
Net assets acquired | $ | 140 |
|
______________________
(a) Goodwill is expected to be deductible for tax purposes.
(b) Franchise agreements have a weighted average life of 25 years.
This acquisition was assigned to the Company’s Hotel Franchising segment and was not material to Wyndham Hotels’ results of operations, financial position or cash flows. In connection with the acquisition of AmericInn, Wyndham Hotels incurred $2 million of acquisition-related costs, which are reported within transaction-related costs on the Consolidated and Combined Statements of Income.
The Fen Hotels Acquisition
During November 2016, Wyndham Hotels completed the acquisition of Fen Hotels, a hotel franchising and manager of properties with a focus in the Latin America region, for $70 million, net of cash acquired. This acquisition is consistent with Wyndham Hotels’ strategy to expand its managed portfolio within its hotel management business. The acquisition resulted in the addition of two brands (Dazzler and Esplendor) to the Wyndham Hotels portfolio.
The following table summarizes the fair value of the assets acquired and liabilities assumed in connection with Wyndham Hotels’ acquisition of Fen Hotels:
|
| | | |
| Amount |
Trade receivables | $ | 1 |
|
Goodwill (a) | 49 |
|
Management contracts | 15 |
|
Trademarks (b) | 10 |
|
Total assets acquired | 75 |
|
Other current liabilities | 1 |
|
Other non-current liabilities | 4 |
|
Total liabilities acquired | 5 |
|
Net assets acquired | $ | 70 |
|
_____________________________
(a) Goodwill is not expected to be deductible for tax purposes.
(b) Trademarks have a weighted average life of 20 years.
This acquisition was assigned to the Company’s Hotel Franchising and Hotel Management segments and was not material to Wyndham Hotels’ results of operations, financial position or cash flows. In connection with the acquisition of Fen Hotels, Wyndham Hotels incurred $1 million of acquisition-related costs, which are reported within transaction-related costs on the Consolidated and Combined Statements of Income.
Intangible assets consisted of:
|
| | | | | | | | | | | | | | | | | | | | | | | |
| As of December 31, 2018 | | As of December 31, 2017 |
| Gross
Carrying
Amount | | Accumulated
Amortization | | Net
Carrying
Amount | | Gross
Carrying
Amount | | Accumulated
Amortization | | Net
Carrying
Amount |
Unamortized Intangible Assets: | | | | | | | | | | | |
Goodwill | $ | 1,547 |
| | | | | | $ | 423 |
| | | | |
Trademarks (a) | $ | 1,393 |
| | | | | | $ | 683 |
| | | | |
Amortized Intangible Assets: | | | | | | | | | | | |
Franchise agreements (b) | $ | 895 |
| | $ | 434 |
| | $ | 461 |
| | $ | 640 |
| | $ | 417 |
| | $ | 223 |
|
Management agreements (c) | 140 |
| | 13 |
| | 127 |
| | 33 |
| | 8 |
| | 25 |
|
Trademarks (d) | 5 |
| | 1 |
| | 4 |
| | 10 |
| | 1 |
| | 9 |
|
Other (e) | 6 |
| | 4 |
| | 2 |
| | 6 |
| | 3 |
| | 3 |
|
| $ | 1,046 |
| | $ | 452 |
| | $ | 594 |
| | $ | 689 |
| | $ | 429 |
|
| $ | 260 |
|
______________________
| |
(a) | Comprised of various trademarks that the Company has acquired. These trademarks are expected to generate future cash flows for an indefinite period of time. |
| |
(b) | Amortized over a period ranging from 20 to 40 years with a weighted average life of 31 years. |
| |
(c) | Amortized over a period ranging from 7 to 22 years with a weighted average life of 15 years. |
| |
(d) | Amortized over a period of 20 years with a weighted average life of 20 years. |
| |
(e) | Amortized over a period ranging from 3 to 5 years with a weighted average life of 4 years. |
The changes in the carrying amount of goodwill are as follows:
|
| | | | | | | | | | | | | | | | | | | | | | | |
| Balance as of January 1, 2017 | | Goodwill Acquired During 2017 | | Balance as of December 31, 2017 | | Goodwill Acquired During 2018 | | Adjustments to Goodwill (a) | | Balance as of December 31, 2018 |
| | | | | |
| | | | | |
Hotel Franchising | $ | 340 |
| | $ | 45 |
| | $ | 385 |
| | $ | 1,067 |
| | $ | (3 | ) | | $ | 1,449 |
|
Hotel Management | 37 |
| | 1 |
| | 38 |
| | 60 |
| | — |
| | 98 |
|
Total | $ | 377 |
| | $ | 46 |
| | $ | 423 |
|
| $ | 1,127 |
| | $ | (3 | ) |
| $ | 1,547 |
|
______________________
| |
(a) | Includes $2 million related to the sale of Knights Inn brand in May 2018. |
Amortization expense relating to amortizable intangible assets was as follows:
|
| | | | | | | | | | | |
| 2018 | | 2017 | | 2016 |
Franchise agreements | $ | 22 |
| | $ | 16 |
| | $ | 15 |
|
Management agreements | 7 |
| | 3 |
| | 2 |
|
Trademarks | 1 |
| | 1 |
| | — |
|
Other | 1 |
| | — |
| | 1 |
|
Total (a) | $ | 31 |
| | $ | 20 |
| | $ | 18 |
|
______________________
| |
(a) | Included as a component of depreciation and amortization on the Consolidated and Combined Statements of Income. |
Based on Wyndham Hotels’ amortizable intangible assets as of December 31, 2018, the Company expects related amortization expense as follows:
|
| | | |
| Amount |
2019 | $ | 37 |
|
2020 | 37 |
|
2021 | 37 |
|
2022 | 35 |
|
2023 | 34 |
|
| |
7. | Franchising, Marketing and Reservation Activities |
Royalties and franchise fee revenues on the Consolidated and Combined Statements of Income include initial franchise fees of $20 million, $14 million and $19 million in 2018, 2017 and 2016 respectively.
In accordance with its franchise agreements, generally Wyndham Hotels is contractually obligated to expend the marketing and reservation fees it collects from franchisees for the operation of an international, centralized, brand-specific reservation system and for marketing purposes such as advertising, promotional and co-marketing programs, and training for the respective franchisees. Additionally, the Company is required to provide certain services to its franchisees, including technology and purchasing programs.
The Company may, at its discretion, provide development advance notes to certain franchisees or hotel owners in order to assist them in converting to one of Wyndham Hotels’ brands, building a new hotel to be flagged under one of Wyndham Hotels’ brands or in assisting in other franchisee expansion efforts. Provided the franchisee/hotel owner is in compliance with the terms of the franchise/management agreement, all or a portion of the development advance notes may be forgiven by Wyndham Hotels over the period of the franchise/management agreement, which typically ranges from 10 to 20 years. Otherwise, the related principal is due and payable to Wyndham Hotels. In certain instances, Wyndham Hotels may earn interest on unpaid franchisee development advance notes. Such interest was $1 million during 2018, and was not significant during 2017 and 2016. Development advance notes recorded on the Consolidated and Combined Balance Sheets amounted to $78 million and $64 million as of December 31, 2018 and December 31, 2017, respectively, and are classified within other non-current assets on the Consolidated and Combined Balance Sheets. During 2018, 2017 and 2016 the Company recorded $7 million, $6 million and $7 million related to the forgiveness of these notes. Such amounts are recorded as a reduction of franchise fees on the Consolidated and Combined Statements of Income. The Company recorded $1 million during 2018, less than $1 million during 2017, and $1 million during 2016 of bad debt expenses related to development advance notes. Such expenses were reported within operating expenses on the Consolidated and Combined Statements of Income. The Company received $14 million, $7 million and $3 million of proceeds from repayment of development advance notes during 2018, 2017 and 2016 respectively, and issued $27 million, $8 million and $9 million of development advance notes during 2018, 2017 and 2016, respectively. These amounts are reflected gross in operating activities on the Consolidated and Combined Statements of Cash Flows.
In December 2017, the United States enacted the Tax Cuts and Jobs Act (‘‘U.S. tax reform’’) and significantly changed U.S. corporate income tax laws by reducing the U.S. corporate income tax rate from 35% to 21% starting in 2018, and imposing a one-time mandatory deemed repatriation tax on undistributed historical earnings of foreign subsidiaries. Other provisions of the law were not effective until January 1, 2018 and include, but are not limited to, creating a territorial tax system which generally eliminates U.S. federal income taxes on dividends from foreign subsidiaries, eliminating or limiting the deduction of certain expenses, and imposing a minimum tax on earnings generated by foreign subsidiaries.
As of December 31, 2017, the Company had made a reasonable estimate for (i) the remeasurement of its net deferred income tax and uncertain tax liabilities based on the new reduced U.S. corporate income tax rate and (ii) the one-time deemed repatriation tax on our undistributed historical earnings of foreign subsidiaries. With respect to certain other items, the Company had not yet been able to make a reasonable estimate and continued to account for those items based on its existing accounting under GAAP and the provisions of the tax laws that were in effect prior to enactment of the U.S. tax reform. One such case was the Company’s intent regarding whether to continue to assert indefinite reinvestment on a part or all the undistributed foreign earnings. During the fourth quarter of 2018, the Company completed its accounting for the tax effects of the U.S. tax reform recorded for 2017. The following table presents the impact of the accounting for the enactment of U.S. tax reform on our provision for (benefit from) income taxes:
|
| | | | | | | | |
| | Year Ended December 31, |
| | 2018 | | 2017 |
Remeasurement of net deferred income tax and uncertain tax liabilities | | $ | (2 | ) | | $ | (87 | ) |
One-time deemed repatriation tax on undistributed historical earnings of foreign subsidiaries | | (2 | ) | | 2 |
|
Total provision for (benefit from) income taxes impact | | $ | (4 | ) | | $ | (85 | ) |
Although the one-time mandatory deemed repatriation tax during 2017 and the territorial tax system created as a result of U.S. tax reform generally eliminate U.S. federal income taxes on dividends from foreign subsidiaries, the Company continues to assert that all of the undistributed foreign earnings of $39 million will be reinvested indefinitely as of December 31, 2018. In the event the Company determines not to continue to assert that all or part of its undistributed foreign earnings are permanently reinvested, such a determination in the future could result in the accrual and payment of additional foreign withholding taxes and U.S. taxes on currency transaction gains and losses, the determination of which is not practicable.
The income tax provision consists of the following:
|
| | | | | | | | | | | | |
| | Year Ended December 31, |
| | 2018 | | 2017 | | 2016 |
Current | | | | | |
| Federal | $ | 34 |
| | $ | 84 |
| | $ | 67 |
|
| State | 13 |
| | 13 |
| | 16 |
|
| Foreign | 14 |
| | 7 |
| | 9 |
|
| | 61 |
| | 104 |
| | 92 |
|
Deferred | | |
| | |
| Federal | 2 |
| | (89 | ) | | 22 |
|
| State | (2 | ) | | (1 | ) | | 4 |
|
| Foreign | — |
| | (1 | ) | | — |
|
| | — |
| | (91 | ) | | 26 |
|
Provision for income taxes | $ | 61 |
| | $ | 13 |
| | $ | 118 |
|
Pretax income for domestic and foreign operations consisted of the following:
|
| | | | | | | | | | | |
| Year Ended December 31, |
| 2018 | | 2017 | | 2016 |
Domestic | $ | 190 |
| | $ | 234 |
| | $ | 271 |
|
Foreign | 33 |
| | 9 |
| | 23 |
|
Pretax income | $ | 223 |
| | $ | 243 |
| | $ | 294 |
|
Deferred Taxes
Deferred income tax assets and liabilities are comprised of the following:
|
| | | | | | | | |
| | As of December 31, |
| | 2018 | | 2017 |
Deferred income tax assets: | | | |
| Accrued liabilities and deferred income | $ | 87 |
| | $ | 53 |
|
| Tax credits (a) | 12 |
| | — |
|
| Provision for doubtful accounts | 20 |
| | 22 |
|
| Net operating loss carryforward (b) | 14 |
| | 10 |
|
| Other | 14 |
| | 2 |
|
| Valuation allowance (c) | (15 | ) | | (9 | ) |
Deferred income tax assets | 132 |
| | 78 |
|
| | | | |
Deferred income tax liabilities: | | | |
| Depreciation and amortization | 517 |
| | 241 |
|
| Other | 12 |
| | 8 |
|
Deferred income tax liabilities | 529 |
| | 249 |
|
| Net deferred income tax liabilities | $ | 397 |
| | $ | 171 |
|
| | | | |
Reported in: | | | |
Other non-current assets | $ | 2 |
| | $ | 2 |
|
Deferred income taxes | 399 |
| | 173 |
|
| Net deferred income tax liabilities | $ | 397 |
| | $ | 171 |
|
_____________________________
| |
(a) | As of December 31, 2018, the Company had $6 million of foreign tax credits. The foreign tax credits primarily expire in 2028. |
| |
(b) | As of December 31, 2018, the Company’s net operating loss carryforwards primarily relate to state net operating losses, which are due to expire at various dates, but no later than 2038. |
| |
(c) | The valuation allowance of $15 million at December 31, 2018 relates to net operating loss carryforwards, certain deferred tax assets and foreign tax credits of $11 million, $3 million and $1 million, respectively. The valuation allowance of $9 million at December 31, 2017 relates to net operating loss carryforwards of $8 million and certain deferred tax assets of $1 million. The valuation allowance will be reduced when and if the Company determines it is more likely than not that the related deferred income tax assets will be realized. |
The Company’s effective income tax rate differs from the U.S. federal statutory rate as follows for the years ended December 31:
|
| | | | | | | | |
| 2018 | | 2017 | | 2016 |
Federal statutory rate | 21.0 | % | | 35.0 | % | | 35.0 | % |
State and local income taxes, net of federal tax benefits | 2.9 |
| | 3.6 |
| | 4.5 |
|
Taxes on foreign operations at rates different than U.S. federal statutory rates | 1.9 |
| | 0.8 |
| | (0.2 | ) |
Taxes on foreign income, net of tax credits | 0.3 |
| | 0.4 |
| | 0.1 |
|
Valuation allowances | 1.4 |
| | (0.1 | ) | | (0.2 | ) |
Impact of U.S. tax reform | (1.8 | ) | | (34.9 | ) | | — |
|
Other | 1.7 |
| | 0.5 |
| | 0.9 |
|
| 27.4 | % | | 5.3 | % | | 40.1 | % |
The effective income tax rate for 2018 differs from the U.S. Federal income tax rate of 21% primarily due to U.S. and foreign taxes on the Company’s international operations and state taxes. The effective income tax rate for 2017 and 2016 differs from the U.S. Federal income tax rate of 35% primarily due to state taxes and the net tax benefit, during 2017, from the impact of U.S. tax reform.
The following table summarizes the activity related to the Company’s unrecognized tax benefits:
|
| | | | | | | | | | | |
| 2018 | | 2017 | | 2016 |
Beginning Balance | $ | 12 |
| | $ | 13 |
| | $ | 11 |
|
Increases related to tax positions taken during a prior period | 2 |
| | — |
| | 1 |
|
Increases related to tax positions taken during the current period | 1 |
| | 2 |
| | 3 |
|
Decreases related to settlements with taxing authorities | — |
| | — |
| | — |
|
Decreases as a result of a lapse of the applicable statute of limitations | (2 | ) | | (2 | ) | | (1 | ) |
Decreases related to tax positions taken during a prior period | — |
| | (1 | ) | | (1 | ) |
Ending Balance | $ | 13 |
| | $ | 12 |
| | $ | 13 |
|
The gross amount of the unrecognized tax benefits that, if recognized, would affect the Company’s effective tax rate was $13 million, $12 million and $13 million as of December 31, 2018, 2017 and 2016, respectively. The Company recorded both accrued interest and penalties related to unrecognized tax benefits as a component of provision for income taxes on the Consolidated and Combined Statements of Income. The Company also accrued potential penalties and interest related to these unrecognized tax benefits of $1 million during 2018, less than $1 million during 2017, and $1 million during 2016. The Company had a liability for potential penalties of $2 million as of December 31, 2018 and $2 million for both December 31, 2017 and 2016 and potential interest of $3 million, $3 million, and $2 million as of December 31, 2018, 2017 and 2016, respectively. Such liabilities are reported as a component of accrued expenses and other current liabilities and other non-current liabilities on the Consolidated and Combined Balance Sheets. The Company does not expect the unrecognized tax benefits to change significantly over the next 12 months.
The Company files income tax returns in the U.S. federal and state jurisdictions, as well as in foreign jurisdictions. Prior to our spin-off, the Company was part of a consolidated U.S. federal income tax return and consolidated and combined state returns with its former Parent and other subsidiaries that are not included in its Consolidated and Combined Financial Statements. Income taxes as presented in the Company's Consolidated and Combined Financial Statements prior to our spin-off presented current and deferred income taxes of the consolidated federal tax filing attributed to the Company using the separate return method. The separate return method applies the accounting guidance for income taxes to the financial statements as if the Company was a separate taxpayer. The 2015 through 2018 tax years generally remain subject to examination by federal tax authorities, as part of the Company’s former Parent filing. The 2009 through 2018 tax years generally remain subject to examination by many state tax authorities. In significant foreign jurisdictions, the 2011 through the 2018 tax years generally remain subject to examination by their respective tax authorities. The statute of limitations is scheduled to expire within 12 months of the reporting date in certain taxing jurisdictions, and the Company therefore believes that it is reasonably possible that the total amount of its unrecognized tax benefits could decrease by $2 million to $3 million.
During the years 2018, 2017 and 2016, the former Parent paid $27 million, $93 million and $78 million, respectively, of federal and state income tax liabilities related to the Company, which is reflected in its Condensed and Consolidated
Financial Statements as an increase in former Parent’s net investment. Following the Company’s spin-off, the Company made federal and state income tax payments, net of refunds, in the amount of $39 million. Additionally, the Company made foreign income tax payments, net of refunds, in the amount of $12 million in 2018 and 2017 and $7 million in 2016.
Wyndham Hotels measures its financial assets and liabilities at fair value on a recurring basis and utilizes the fair value hierarchy to determine such fair values. Financial assets and liabilities carried at fair value are classified and disclosed in one of the following three categories:
Level 1: Quoted prices for identical instruments in active markets.
Level 2: Quoted prices for similar instruments in active markets; quoted prices for identical or similar instruments in markets that are not active; and model-derived valuations whose inputs are observable or whose significant value driver is observable.
Level 3: Unobservable inputs used when little or no market data is available. In certain cases, the inputs used to measure fair value may fall into different levels of the fair value hierarchy. In such cases, the level in the fair value hierarchy within which the fair value measurement falls has been determined based on the lowest level input (closest to Level 3) that is significant to the fair value measurement. Wyndham Hotels’ assessment of the significance of a particular input to the fair value measurement in its entirety requires judgment, and considers factors specific to the asset or liability.
The fair value of financial instruments is generally determined by reference to market values resulting from trading on a national securities exchange or in an over-the-counter market. In cases where quoted market prices are not available, fair value is based on estimates using present value or other valuation techniques, as appropriate. The carrying amounts of cash and cash equivalents, trade receivables, accounts payable and accrued expenses and other current liabilities approximate fair value due to the short-term maturities of these assets and liabilities. The carrying amounts and estimated fair values of all other financial instruments are as follows:
|
| | | | | | | |
| December 31, 2018 |
| Carrying Amount | | Estimated Fair Value |
Debt | | | |
Total debt | $ | 2,141 |
| | $ | 2,091 |
|
The Company estimates the fair value of its debt, excluding capital leases, using Level 2 inputs based on indicative bids from investment banks or quoted market prices.
Financial Instruments
Changes in interest rates and foreign exchange rates expose Wyndham Hotels to market risk. The Company uses cash flow hedges as part of its overall strategy to manage its exposure to market risks associated with fluctuations in interest rates and foreign currency exchange rates. As a matter of policy, the Company only enters into transactions that it believes will be highly effective at offsetting the underlying risk, and it does not use derivatives for trading or speculative purposes.
Interest Rate Risk
A portion of debt used to finance the Company’s operations is exposed to interest rate fluctuations. The Company uses various hedging strategies and derivative financial instruments to create a desired mix of fixed and floating rate assets and liabilities. Derivative instruments currently used in these hedging strategies include interest rate swaps. The derivatives used to manage the risk associated with the Company’s floating rate debt are derivatives designated as cash flow hedges. The amount of gains or losses the Company expects to reclassify from AOCI to earnings during the next 12 months is not material.
Foreign Currency Risk
The Company has currency rate exposure to exchange rate fluctuations worldwide particularly with respect to the Canadian Dollar, the Chinese Yuan, the Euro, the British Pound and the Argentine Peso. The Company uses foreign currency
forward contracts at various times to manage and reduce the currency exchange rate risk associated with its foreign currency denominated receivables and payables, forecasted royalties, and forecasted earnings and cash flows of foreign subsidiaries and other transactions. Losses recognized in income from freestanding foreign currency exchange contracts were $2 million for 2018 and 2017. Gains recognized in income from freestanding foreign currency exchange contracts were $2 million in 2016.
As required, the Company began accounting for Argentina as a highly inflationary economy as of July 1, 2018. The Company incurred $3 million in foreign currency exchange losses related to Argentina during 2018. Such losses are included in operating expenses in the Consolidated and Combined Statements of Income.
Credit Risk and Exposure
The Company is exposed to counterparty credit risk in the event of nonperformance by counterparties to various agreements and sales transactions. The Company manages such risk by evaluating the financial position and creditworthiness of such counterparties and often by requiring collateral in instances in which financing is provided. The Company mitigates counterparty credit risk associated with its derivative contracts by monitoring the amounts at risk with each counterparty to such contracts, periodically evaluating counterparty creditworthiness and financial position, and where possible, dispersing its risk among multiple counterparties.
As of December 31, 2018, Wyndham Hotels had $46 million of management guarantee receivables related to hotel management agreements that provide the owner of the hotels with a guarantee of a certain level of profitability based upon various metrics. The collectability of these receivables is contingent on the future profitability of the managed hotels subject to the management agreements. See Note 13 - Commitments and Contingencies for further detail.
Market Risk
The Company is subject to risks relating to the geographic concentration of its hotel properties, which may result in the Company's results of operations being more sensitive to local and regional economic conditions and other factors, including competition, natural disasters and economic downturns, than the Company's results of operations would be, absent such geographic concentrations. Local and regional economic conditions and other factors may differ materially from prevailing conditions in other parts of the world. Included within the Consolidated and Combined Statements of Income are net revenues from transactions in the states of Texas and Florida of approximately 12% and 10%, respectively, during 2018.
During 2018, the Company had one customer which accounted for 22% of net revenues. Excluding cost reimbursement revenues, which are offset by cost reimbursement expenses, such customer accounted for 6% of the Company's net revenues.
| |
10. | Property and Equipment, net |
Property and equipment, net consisted of:
|
| | | | | | | |
| As of December 31, |
| 2018 | | 2017 |
Land | $ | 17 |
| | $ | 14 |
|
Buildings and leasehold improvements | 212 |
| | 171 |
|
Capitalized software | 292 |
| | 242 |
|
Furniture, fixtures and equipment | 86 |
| | 69 |
|
Capital leases | 72 |
| | 5 |
|
Construction in progress | 22 |
| | 12 |
|
| 701 |
| | 513 |
|
Less: Accumulated depreciation | 375 |
| | 263 |
|
| $ | 326 |
| | $ | 250 |
|
Wyndham Hotels recorded depreciation expense of $68 million during 2018 and $55 million during 2017 and 2016, related to property and equipment.
| |
11. | Accrued Expenses and Other Current Liabilities |
Accrued Expenses and Other Current Liabilities consisted of:
|
| | | | | | | |
| As of December 31, |
| 2018 | | 2017 |
La Quinta tax liability (Note 5) | $ | 205 |
| | $ | — |
|
Accrued payroll and related expenses | 109 |
| | 70 |
|
Accrued loyalty program liabilities | 54 |
| | 47 |
|
Accrued legal settlements (Note 13) | 25 |
| | 3 |
|
Accrued separation expenses | 19 |
| | 1 |
|
Accrued taxes payable | 15 |
| | 10 |
|
Accrued self-insurance liabilities | 15 |
| | — |
|
Due to former parent | 11 |
| | — |
|
Accrued marketing expenses | 8 |
| | 23 |
|
Other | 41 |
| | 32 |
|
| $ | 502 |
| | $ | 186 |
|
| |
12. | Long-Term Debt and Borrowing Arrangements |
The Company’s indebtedness consisted of:
|
| | | | | | | |
| As of December 31, |
| 2018 | | 2017 |
Long-term debt: (a) | | | |
$750 million revolving credit facility (due May 2023) | $ | — |
| | $ | — |
|
Term loan (due May 2025) | 1,582 |
| | — |
|
5.375% senior unsecured notes (due April 2026) | 494 |
| | — |
|
Capital leases | 65 |
| | — |
|
Debt due to former Parent | — |
| | 184 |
|
Total long-term debt | 2,141 |
| | 184 |
|
Less: Current portion of long-term debt | 21 |
| | 103 |
|
Long-term debt | $ | 2,120 |
| | $ | 81 |
|
______________________
| |
(a) | The carrying amount of the term loan and senior unsecured notes are net of debt issuance costs of $21 million as of December 31, 2018. |
Maturities and Capacity
The Company’s outstanding debt as of December 31, 2018 matures as follows:
|
| | | |
| Long-Term Debt |
Within 1 year | $ | 21 |
|
Between 1 and 2 years | 21 |
|
Between 2 and 3 years | 21 |
|
Between 3 and 4 years | 21 |
|
Between 4 and 5 years | 22 |
|
Thereafter | 2,035 |
|
Total | $ | 2,141 |
|
As of December 31, 2018, the available capacity under the Company’s revolving credit facility was as follows:
|
| | | |
| Revolving Credit Facility |
Total capacity | $ | 750 |
|
Less: Letters of credit | 15 |
|
Available capacity | $ | 735 |
|
Long-Term Debt
$750 million Revolving Credit Facility. During May 2018, the Company entered into an agreement for a $750 million revolving credit facility expiring in May 2023. This facility is subject to an interest rate per annum equal to, at Wyndham Hotels’ option, either a base rate plus a margin ranging from 0.50% to 1.00% or LIBOR plus a margin ranging from 1.50% to 2.00%, in either case based upon the total leverage ratio of the Company and its restricted subsidiaries. In addition, Wyndham Hotels will pay a commitment fee on the unused portion of the revolving credit facility of 0.20% per annum.
$1.6 billion Term Loan Agreement. During May 2018, the Company entered a credit agreement for a $1.6 billion term loan (the “Term Loan”) expiring in May 2025. The interest rate per annum applicable to the Term Loan is equal to, at the Company’s option, either a base rate plus a margin of 0.75% or LIBOR plus a margin of 1.75%. The LIBOR rate with respect to the Term Loan is subject to a “floor” of 0.00%. The Term Loan began amortizing in equal quarterly installments beginning in the fourth quarter of 2018 in aggregate annual amounts equal to 1.00% of the original principal amount thereof. The Term Loan is subject to standard mandatory prepayment provisions including (i) 100% of the net cash proceeds from issuances or incurrence of debt by Wyndham Hotels or any of its restricted subsidiaries (other than with respect to certain permitted indebtedness); (ii) 100% (with step-downs to 50% and 0% based upon achievement of specified first-lien leverage ratios) of the net cash proceeds from certain sales or other dispositions of assets by Wyndham Hotels or any of its restricted subsidiaries in excess of a certain amount and subject to customary reinvestment provisions and certain other exceptions; and (iii) 50% (with step-downs to 25% and 0% based upon achievement of specified first-lien leverage ratios) of annual (commencing with the 2019 fiscal year) excess cash flow of Wyndham Hotels and its restricted subsidiaries, subject to customary exceptions and limitations.
The revolving credit facility and term loan (the “Credit Facilities”) are guaranteed, jointly and severally, by certain of Wyndham Hotels & Resorts, Inc.’s wholly-owned domestic subsidiaries and secured by a first-priority security interest in substantially all of the assets of Wyndham Hotels & Resorts, Inc. and those subsidiaries. The Credit Facilities were initially guaranteed by Wyndham Worldwide, which guarantee was released immediately prior to the consummation of the spin-off. The Credit Facilities contain customary covenants that, among other things, restrict, subject to certain exceptions, Wyndham Hotels & Resorts, Inc. and its restricted subsidiaries’ ability to grant liens on Wyndham Hotels & Resorts, Inc. and its restricted subsidiaries’ assets, incur indebtedness, sell assets, make investments, engage in acquisitions, mergers or consolidations and pay certain dividends and other restricted payments. The Credit Facilities require Wyndham Hotels & Resorts, Inc. to comply with financial maintenance covenants to be tested quarterly, consisting of a maximum first-lien leverage ratio.
Subject to customary conditions and restrictions, Wyndham Hotels & Resorts, Inc. may obtain incremental term loans and/or revolving loans in an aggregate amount not to exceed (i) the greater of $550 million and 100% of EBITDA, plus (ii) the amount of all voluntary prepayments and commitment reductions under the Credit Facilities, plus (iii) additional amounts subject to certain leverage-based ratio tests.
The Credit Facilities also contain certain customary events of default, including, but not limited to: (i) failure to pay principal, interest, fees or other amounts under the Credit Facilities when due, taking into account any applicable grace period; (ii) any representation or warranty proving to have been incorrect in any material respect when made; (iii) failure to perform or observe covenants or other terms of the Credit Facilities subject to certain grace periods; (iv) a cross-default and cross-acceleration with certain other material debt; (v) bankruptcy events; (vi) certain defaults under ERISA; and (vii) the invalidity or impairment of security interests.
5.375% Senior Unsecured Notes. In April 2018, the Company issued $500 million of senior unsecured notes, which mature in 2026 and bear interest at a rate of 5.375% per year, for net proceeds of $493 million. Interest is payable semi-annually in arrears on October 15 and April 15 of each year, commencing on October 15, 2018.
The notes were initially guaranteed by Wyndham Worldwide on a senior unsecured basis and, immediately prior to the consummation of the spin-off, Wyndham Worldwide’s guarantee of the notes was released. During May 2018, the Company entered into a second supplemental indenture with certain of its wholly owned domestic subsidiaries, pursuant to which they became guarantors of the notes.
The Company used the net cash proceeds from the notes to replace a portion of Wyndham Worldwide’s bridge term loan facility, reducing former Parent’s outstanding bridge term loan facility commitments to approximately $1.5 billion. The remainder of the bridge term loan facility, which had been put in place to provide funding for the La Quinta acquisition, was terminated in conjunction with the issuance of the Term Loan.
Capital Lease. In connection with the Company’s separation from Wyndham Worldwide, Wyndham Hotels was assigned the lease for its corporate headquarters located in Parsippany, New Jersey from its former Parent, which resulted in the Company recording a capital lease obligation and asset of $66 million and $43 million, respectively. Such capital lease has an interest rate of 4.5% during 2018.
Deferred Financing Costs
The Company classifies unamortized debt issuance costs related to its revolving credit facility within other non-current assets on the Consolidated and Combined Balance Sheets, which was $5 million as of December 31, 2018.
Cash Flow Hedge
On May 30, 2018, Wyndham Hotels hedged a portion of its $1.6 billion term loan. The pay-fixed/receive-variable interest rate swaps have a total notional amount $1.0 billion, of which $500 million had an initial term of five years and $500 million had an initial term of two and half years, with fixed rates of 2.66% and 2.52%, respectively. The variable rates of the swap agreements are based on one-month LIBOR. The aggregate fair value of these interest rate swaps was a $5 million liability as of December 31, 2018, which was included within other non-current liabilities on the Consolidated and Combined Balance Sheet. The loss recognized in accumulated other comprehensive income during 2018 was $4 million.
Debt Due to former Parent
During May 2018, the Company’s former Parent contributed $197 million of debt that was due from a subsidiary of Wyndham Hotels. As of December 31, 2017, Wyndham Hotels had $184 million of outstanding borrowings from its former Parent.
Interest Expense, Net
Wyndham Hotels incurred interest expense of $67 million, $7 million and $1 million in 2018, 2017 and 2016, respectively. Cash paid related to such interest was $56 million for 2018. Interest income was $7 million, $1 million and less than $1 million for 2018, 2017 and 2016, respectively.
| |
13. | Commitments and Contingencies |
Commitments
Leases
Wyndham Hotels has noncancelable operating lease commitments covering various facilities and equipment. Future minimum lease payments required under noncancelable operating leases as of December 31, 2018 are as follows:
|
| | | |
| Noncancelable Operating Leases |
2019 | $ | 6 |
|
2020 | 4 |
|
2021 | 3 |
|
2022 | 2 |
|
| $ | 15 |
|
Wyndham Hotels incurred total rent expense of $8 million, $5 million and $4 million during 2018, 2017 and 2016, respectively.
Purchase Commitments
In the normal course of business, Wyndham Hotels makes various commitments to purchase goods or services and other capital expenditures from specific suppliers. Purchase commitments entered into by Wyndham Hotels aggregated $130 million as of December 31, 2018, of which $89 million was for information technology. In addition, the Company assumed a tax liability of $205 million related to the La Quinta acquisition which is expected to be paid in early 2019 to tax authorities and/or CorePoint.
Litigation
Wyndham Hotels is involved, at times, in claims, legal and regulatory proceedings and governmental inquiries arising in the ordinary course of its business, including but not limited to: breach of contract, fraud and bad faith claims with franchisees in connection with franchise agreements and with owners in connection with management contracts, negligence, breach of contract, fraud, employment, consumer protection and other statutory claims asserted in connection with alleged acts or occurrences at owned, franchised or managed properties or in relation to guest reservations and bookings. The Company may also at times be involved in claims, legal and regulatory proceedings and governmental inquiries relating to bankruptcy proceedings involving efforts to collect receivables from a debtor in bankruptcy, employment matters, claims of infringement upon third parties’ intellectual property rights, claims relating to information security, privacy and consumer protection, fiduciary duty/trust claims, tax claims, environmental claims and landlord/tenant disputes.
The Company will assume one-third of certain contingent and other corporate liabilities of Wyndham Worldwide incurred prior to the spin-off, including liabilities of Wyndham Worldwide related to, arising out of or resulting from certain terminated or divested businesses, certain general corporate matters of Wyndham Worldwide and any actions with respect to the separation plan or the distribution made or brought by any third party.
Wyndham Hotels records an accrual for legal contingencies when it determines, after consultation with outside counsel, that it is probable that a liability has been incurred and the amount of the loss can be reasonably estimated. In making such determinations, Wyndham Hotels evaluates, among other things, the degree of probability of an unfavorable outcome, and when it is probable that a liability has been incurred, its ability to make a reasonable estimate of loss. Wyndham Hotels reviews these accruals each reporting period and makes revisions based on changes in facts and circumstances, including changes to its strategy in dealing with these matters.
Wyndham Hotels believes that it has adequately accrued for such matters with reserves of $25 million and $3 million as of December 31, 2018 and December 31, 2017. The Company also had receivables of $21 million as of December 31, 2018 for certain matters which are covered by insurance and were included in other current assets on its Consolidated and Combined Balance Sheet. For matters not requiring accrual, Wyndham Hotels believes that such matters will not have a material effect on its results of operations, financial position or cash flows based on information currently available. However, litigation is inherently unpredictable and, although Wyndham Hotels believes that its accruals are adequate and/or that it has valid defenses in these matters, unfavorable results could occur. As such, an adverse outcome from such proceedings for which claims are awarded in excess of the amounts accrued, if any, could be material to Wyndham Hotels with respect to earnings and/or cash flows in any given reporting period. As of December 31, 2018, the potential exposure resulting from adverse outcomes of such legal proceedings could, in the aggregate, range up to approximately $35 million in excess of recorded accruals. However, Wyndham Hotels does not believe that the impact of such litigation will result in a material liability to Wyndham Hotels in relation to its combined financial position or liquidity.
Guarantees
Hotel Management Guarantees
The Company has entered into hotel management agreements that provide the hotel owner with a guarantee of a certain level of profitability based upon various metrics. Under such agreements, the Company would be required to compensate the hotel owner for any profitability shortfall over the life of the management agreement up to a specified aggregate amount. For certain agreements, the Company may be able to recapture all or a portion of the shortfall payments in the event that future operating results exceed targets. The original terms of the Company’s existing guarantees range from nine to ten years. As of December 31, 2018, the maximum potential amount of future payments that may be made under these guarantees was $103 million with a combined annual cap of $26 million. In 2018, the Company expensed $4 million related to such guarantees.
These guarantees have a remaining life of approximately four to five years with a weighted average life of approximately four years.
In connection with its performance guarantees, as of December 31, 2018, the Company maintained a liability of $24 million, of which $15 million was included in other non-current liabilities and $9 million was included in accrued expenses and other current liabilities on its Consolidated and Combined Balance Sheet. As of December 31, 2018, the Company also had a corresponding $11 million asset related to these guarantees, of which $10 million was included in other non-current assets and $1 million was included in other current assets on its Consolidated and Combined Balance Sheet. As of December 31, 2017, the Company maintained a liability of $23 million, of which $16 million was included in other non-current liabilities and $7 million was included in accrued expenses and other current liabilities on its Consolidated and Combined Balance Sheet. As of December 31, 2017, the Company also had a corresponding $12 million asset related to the guarantees, of which $1 million was included in other current assets and $11 million was included in other non-current assets on its Consolidated and Combined Balance Sheet. Such assets are being amortized on a straight-line basis over the life of the agreements. The amortization expense for the performance guarantees noted above was $1 million, $2 million and $4 million for 2018, 2017 and 2016, respectively.
For guarantees subject to recapture provisions, the Company had a receivable of $46 million as of December 31, 2018, of which $45 million was included in other non-current assets and $1 million was included in other current assets on its Consolidated and Combined Balance Sheet. As of December 31, 2017, the Company had a receivable of $41 million which was included in other non-current assets on its Consolidated and Combined Balance Sheet. Such receivables were the result of payments made to date that are subject to recapture and which the Company believes will be recoverable from future operating performance. In addition, as of December 31, 2018 and 2017, the Company also had a receivable of $21 million and $19 million, respectively, of deferred hotel management fees included within other non-current assets on the Consolidated and Combined Balance Sheets. Such receivables are fully offset by the $21 million and $19 million of deferred hotel management fees which are included within deferred income with the Consolidated and Combined Balance Sheets.
Credit Support Provided and Other Indemnifications relating to Wyndham Worldwide’s Sale of its European Vacation Rentals Business
In May 2018, Wyndham Destination Network, LLC (“WDN”), a subsidiary of Wyndham Worldwide Corporation, completed the sale of Wyndham Worldwide’s European Vacation Rentals business to Compass IV Limited, an affiliate of Platinum Equity, LLC. In connection with the sale of the European Vacation Rentals business, the Company provided certain post-closing credit support in the form of guarantees to help ensure that the business meets the requirements of certain credit card service providers, travel association and regulatory authorities.
During the third quarter of 2018, the Company provided additional post-closing credit support to certain regulatory authorities and Platinum Equity, LLC in the form of guarantees and during the fourth quarter of 2018, the Company was released from a portion of the post-closing credit support guarantees.
Pursuant to the terms of the Separation and Distribution Agreement that was entered into in connection with the Company’s spin-off, the Company will assume one-third and Wyndham Destinations will assume two-thirds of losses that may be incurred by Wyndham Destinations or the Company in the event that these credit support arrangements are enforced or called upon by any beneficiary in respect of any indemnification claims made.
The table below summaries the post-closing credit support guarantees related to the sale of the European Vacation Rentals business, the fair values of such guarantees and the receivables from its former Parent representing two-thirds of such guarantees at December 31, 2018:
|
| | | | | | | | | | | |
| Guarantees | | Fair Value of Guarantees | | Receivable from former Parent |
Post-closing credit support at time of sale | $ | 87 |
| | $ | 41 |
| | $ | 27 |
|
Additional post-closing credit support | 46 |
| | 22 |
| | 15 |
|
Release of post-closing credit support | (3 | ) | | (1 | ) | | (1 | ) |
Total | $ | 130 |
| | $ | 62 |
| | $ | 41 |
|
The fair value of the guarantees of $62 million was included in other non-current liabilities and the $41 million receivable from its former Parent was included in other non-current assets on its Consolidated and Combined Balance Sheet.
In connection with the sale of the European Vacation Rentals business, the former Parent had deposited $46 million in an escrow account for post-closing credit support to certain regulatory authorities. As a result of the Company providing the additional post-closing credit support during the third quarter of 2018, the $46 million escrow deposit was released to the Company’s former Parent. The Company is entitled to one-third of such escrow deposit refund and as a result, recorded a receivable of $15 million from its former Parent.
During the first quarter of 2019, the working capital adjustment associated with the sale of the European Vacation Rentals business was finalized, which allowed the Company to estimate the net proceeds that Wyndham Destination will generate from the sale of the business. Because the Company is entitled to one-third of the excess of net proceeds above a pre-set amount, the Company recorded a receivable of $24 million from its former Parent as of December 31, 2018. The Company’s total receivable of $39 million from its former Parent was included in current assets on its Consolidated and Combined Balance Sheet. Such receivable will be settled with the Company’s former Parent in conjunction with the final calculation of the net proceeds from the sale of the European Vacation Rentals business.
License Agreement related to Wyndham Worldwide’s Sale of its European Vacation Rentals Business
In connection with its sale, the European Vacation Rentals business entered into a 20-year agreement under which it will pay Wyndham Hotels a royalty fee of 1% of net revenue for the right to use the “by Wyndham” endorser brand. The Company recorded $5 million of royalty fees related to this agreement in 2018.
Transfer of Former Parent Liabilities and Issuances of Guarantees to Former Parent and Affiliates
Upon the distribution of the Company’s common stock to Wyndham Worldwide shareholders, the Company entered into certain guarantee commitments with its former Parent. These guarantee arrangements relate to certain former Parent contingent tax and other corporate liabilities. The Company assumed and is responsible for one-third of such contingent liabilities while its former Parent is responsible for the remaining two-thirds. The amount of liabilities assumed by the Company in connection with the spin-off was $24 million as of December 31, 2018, which were included within other non-current liabilities. The Company also had an $11 million liability due to its former Parent primarily related to taxes which was included within current liabilities on its Consolidated and Combined Balance Sheet. In addition, the Company had $44 million of tax related receivables due from former Parent and subsidiaries as of December 31, 2018, which was included within current assets on its Consolidated and Combined Balance Sheet.
| |
14. | Stock-Based Compensation |
The Company has a stock-based compensation plan available to grant non-qualified stock options, incentive stock options, stock-settled appreciation rights (“SSARs”), RSUs, performance-vesting restricted stock units (“PSUs”) and other stock or cash-based awards to key employees, non-employee directors, advisors and consultants. Under the Wyndham Hotels & Resorts, Inc. 2018 Equity and Incentive Plan, which became effective on May 14, 2018, a maximum of 10.0 million shares of common stock may be awarded. As of December 31, 2018, 7.5 million shares remained available.
Incentive Equity Awards Granted by the Company
On May 17, 2018, Wyndham Hotels’ Board of Directors approved an incentive equity award grant to key employees and senior officers of Wyndham Hotels in the form of RSUs and stock options. Such awards were converted to Wyndham Hotels equity awards on the first day of trading after the Company’s separation from Wyndham Worldwide. The Company granted 0.5 million RSUs and 0.5 million options to key employees during the twelve months ended December 31, 2018. Such RSUs and options vest ratably over a four-year period.
The activity related to the Company’s incentive equity awards from June 1, 2018 through December 31, 2018 consisted of the following:
|
| | | | | | | | | | | | | |
| RSUs | | Options |
| Number of
RSUs | | Weighted
Average
Grant Price | | Number
of
Options | | Weighted
Average
Grant Price |
Balance as of May 31, 2018 | — |
| | $ | — |
| | — |
| | $ | — |
|
Granted(a) | 0.5 |
| | 61.31 |
| | 0.5 |
| | 61.40 |
|
Vested/exercised | — |
| | — |
| | — |
| | — |
|
Balance as of December 31, 2018 | 0.5 |
| (b) | $ | 61.31 |
| | 0.5 |
| (c) | $ | 61.40 |
|
______________________
| |
(a) | Represents awards granted by the Company primarily on June 1, 2018. |
| |
(b) | Approximately 0.5 million RSUs as of December 31, 2018 are expected to vest over time and have an aggregate unrecognized compensation expense of $27 million, which is expected to be recognized over a weighted average period of 3.4 years. |
| |
(c) | Approximately 0.5 million options outstanding as of December 31, 2018 are expected to vest over time and have an aggregate unrecognized compensation expense of $5 million, which is expected to be recognized over 3.4 years. |
The fair value of stock options granted by Wyndham Hotels on June 1, 2018 was estimated to be $11.72 per option on the date of the grant using the Black-Scholes option-pricing model with the relevant weighted average assumptions outlined in the table below. Expected volatility is based on both historical and implied volatilities of the stock of comparable companies over the estimated expected life of the options. The expected life represents the period of time the options are expected to be outstanding. The-risk free interest rate is based on yields on U.S. Treasury strips with a maturity similar to the estimated expected life of the options. The projected dividend yield was based on the Company’s anticipated annual dividend divided by the price of the Company’s stock on the date of the grant.
|
| | |
| 2018 |
Grant date strike price | | $61.40 |
Expected volatility | | 22.72% |
Expected life | | 4.25 years |
Risk-free interest rate | | 2.73% |
Projected dividend yield | | 1.63% |
Stock-Based Compensation Expense for Awards Granted by the Company
Stock-based compensation expense for the awards granted in 2018 to employees amounted to $5 million in 2018. The Company also recorded stock-based compensation expense for non-employee directors of $1 million in 2018.
Incentive Equity Awards Granted by Wyndham Worldwide
Wyndham Worldwide maintained a stock-based compensation plan (the “Stock Plan”) for the benefit of its officers, directors and employees. All share-based compensation awards granted under the Stock Plan related to Wyndham Worldwide common stock. As such, all related equity account balances are reflected in Wyndham Worldwide’s Consolidated Statements of Equity and have not been reflected in Wyndham Hotels’ Consolidated and Combined Financial Statements.
The following disclosures represent stock-based compensation activity attributable to Wyndham Hotels employees under Wyndham Worldwide’s Stock Plan.
Incentive Equity Awards Conversion
Upon the Company’s separation, all outstanding share-based compensation awards granted by Wyndham Worldwide were converted at a ratio of one Wyndham Hotels equity award and one Wyndham Destinations equity award for every one Wyndham Worldwide equity award.
Incentive Equity Award Modification
In August 2017, in conjunction with the anticipated spin-off of Wyndham Hotels, the Wyndham Worldwide board of directors approved certain modifications to the incentive equity awards granted by Wyndham Worldwide. Such modifications were contingent upon the spin-off becoming probable. On May 9, 2018, Wyndham Worldwide’s board of directors approved the spin-off of Wyndham Hotels, resulting in an accelerated vesting of 0.4 million RSUs and 0.1 million performance-based stock units (“PSUs”) for all outstanding equity awards granted prior to 2018. In addition, 0.1 million RSUs not subject to modification will vest in July 2019.
The activity related to RSUs and PSUs granted by Wyndham Worldwide to Wyndham Hotels employees for the year ended December 31, 2018 consisted of the following:
|
| | | | | | | | | | | | | |
| RSUs | | PSUs |
| Number of
RSUs | | Weighted
Average
Grant Price (b) | | Number
of
PSUs | | Weighted
Average
Grant Price |
Balance as of December 31, 2017 | 0.3 |
| | $ | 60.80 |
| | 0.1 |
| | $ | 60.80 |
|
Granted(a) | 0.1 |
| | 64.46 |
| | — |
| | — |
|
Transferred from former Parent (c) | 0.2 |
| | 61.65 |
| | — |
| | — |
|
Vested/canceled | (0.5 | ) | | 60.82 |
| | (0.1 | ) | | 60.80 |
|
Balance as of December 31, 2018 | 0.1 |
| (d) | $ | 64.46 |
| | — |
| | $ | — |
|
______________________
| |
(a) | Represents awards granted by Wyndham Worldwide on March 1, 2018. |
| |
(b) | Weighted average grant prices were adjusted to reflect changes resulting from the modification and separation from Wyndham Worldwide. |
| |
(c) | Represents awards related to employees that transferred from Wyndham Worldwide to Wyndham Hotels upon separation. |
| |
(d) | Approximately 0.1 million outstanding RSUs as of December 31, 2018 are expected to vest over time and have an aggregate unrecognized compensation expense of $4 million which is expected to be recognized over a weighted average period of 0.5 years. |
Stock-Based Compensation Expense Granted by Wyndham Worldwide
Under the Stock Plan, the Company recorded $39 million, $11 million and $10 million of stock-based compensation expense for 2018, 2017 and 2016, respectively, for awards granted to Wyndham Hotel employees. For 2018, $36 million of stock-based compensation expense was recorded within separation-related costs on the Consolidated and Combined Statements of Income. Such separation-related costs included $15 million of expense for 2018 as a result of the modification of the Stock Plan.
The reportable segments presented below represent Wyndham Hotels’ operating segments for which separate financial information is available and is utilized on a regular basis by its chief operating decision maker to assess performance and allocate resources. In identifying its reportable segments, Wyndham Hotels also considers the nature of services provided by its operating segments. Management evaluates the operating results of each of its reportable segments based upon net revenues and “Adjusted EBITDA”, which is defined as net income excluding interest expense, depreciation and amortization, impairment charges, restructuring and related charges, contract termination costs, transaction-related expenses (acquisition-, disposition- or separation-related), foreign currency impacts of highly inflationary countries, stock-based compensation expense, early extinguishment of debt costs and income taxes. Beginning with the third quarter of 2018, Wyndham Hotels’ calculation of Adjusted EBITDA excludes the currency effects of highly inflationary countries. Wyndham Hotels believes that Adjusted EBITDA is a useful measure of performance for its segments which, when considered with U.S. GAAP measures, allows a more complete understanding of its operating performance. Wyndham Hotels’ presentation of Adjusted EBITDA may not be comparable to similarly-titled measures used by other companies.
|
| | | | | | | | | | | | | | | |
| Hotel Franchising | | Hotel Management | | Corporate and Other(a) | | Total |
Year Ended or as of December 31, 2018 | | | | | | | |
Net revenues | $ | 1,135 |
| | $ | 726 |
| | $ | 7 |
| | $ | 1,868 |
|
Adjusted EBITDA | 515 |
| | 47 |
| | (55 | ) | | 507 |
|
Depreciation and amortization | 72 |
| | 21 |
| | 6 |
| | 99 |
|
Segment assets | 3,829 |
| | 580 |
| | 567 |
| | 4,976 |
|
Capital expenditures | 43 |
| | 27 |
| | 3 |
| | 73 |
|
| | | | | | | |
Year Ended or as of December 31, 2017 | | | | | | | |
Net revenues | $ | 897 |
| | $ | 383 |
| | $ | — |
| | $ | 1,280 |
|
Adjusted EBITDA | 402 |
| | 21 |
| | (40 | ) | | 383 |
|
Depreciation and amortization | 59 |
| | 16 |
| | — |
| | 75 |
|
Segment assets | 1,727 |
| | 400 |
| | 10 |
| | 2,137 |
|
Capital expenditures | 35 |
| | 11 |
| | — |
| | 46 |
|
| | | | | | | |
Year Ended or as of December 31, 2016 | | | | | | | |
Net revenues | $ | 881 |
| | $ | 388 |
| | $ | — |
| | $ | 1,269 |
|
Adjusted EBITDA | 400 |
| | 26 |
| | (38 | ) | | 388 |
|
Depreciation and amortization | 58 |
| | 15 |
| | — |
| | 73 |
|
Segment assets | 1,564 |
| | 427 |
| | 7 |
| | 1,998 |
|
Capital expenditures | 30 |
| | 12 |
| | — |
| | 42 |
|
______________________
(a) Includes the elimination of transactions between segments.
Provided below is a reconciliation of Net income to Adjusted EBITDA.
|
| | | | | | | | | | | |
| Year Ended December 31, |
| 2018 | | 2017 | | 2016 |
Net income | $ | 162 |
| | $ | 230 |
| | $ | 176 |
|
Provision for income taxes | 61 |
| | 13 |
| | 118 |
|
Depreciation and amortization | 99 |
| | 75 |
| | 73 |
|
Interest expense, net | 60 |
| | 6 |
| | 1 |
|
Stock-based compensation | 9 |
| | 11 |
| | 10 |
|
Separation-related expenses | 77 |
| | 3 |
| | — |
|
Transaction-related expenses, net | 36 |
| | 3 |
| | 1 |
|
Foreign currency impact of highly inflationary countries | 3 |
| | — |
| | — |
|
Impairment expense | — |
| | 41 |
| | — |
|
Restructuring costs | — |
| | 1 |
| | 2 |
|
Contract termination costs | — |
| | — |
| | 7 |
|
Adjusted EBITDA | $ | 507 |
| | $ | 383 |
| | $ | 388 |
|
The geographic segment information provided below is classified based on the geographic location of Wyndham Hotels’ subsidiaries.
|
| | | | | | | | | | | |
| United States | | All Other Countries | | Total |
Year Ended or As of December 31, 2018 | | | | | |
Net revenues | $ | 1,641 |
| | $ | 227 |
| | $ | 1,868 |
|
Net long-lived assets | 3,681 |
| | 179 |
| | 3,860 |
|
| | | | | |
Year Ended or As of December 31, 2017 | | | | | |
Net revenues | $ | 1,066 |
| | $ | 214 |
| | $ | 1,280 |
|
Net long-lived assets | 1,431 |
| | 185 |
| | 1,616 |
|
| | | | | |
Year Ended or As of December 31, 2016 | | | | | |
Net revenues | $ | 1,066 |
| | $ | 203 |
| | $ | 1,269 |
|
Net long-lived assets | 1,332 |
| | 204 |
| | 1,536 |
|
| |
16. | Separation-Related and Transaction-Related Costs, Impairments and Other Charges |
Separation-Related
On May 31, 2018, Wyndham Worldwide completed the Distribution, which resulted in Wyndham Hotels & Resorts, Inc. becoming a separate, publicly traded company (see Note 1 - Basis of Presentation for further details).
During 2018, the Company incurred $77 million of separation-related costs associated with its spin-off from Wyndham Worldwide. These costs primarily consist of severance, stock-based compensation and other employee-related costs.
Transaction-Related, Net
During 2018, the Company incurred $36 million of transaction-related costs consisting of $59 million primarily related to the Company’s acquisition of La Quinta partially offset by a $23 million gain on the sale of its Knights Inn brand in May 2018. This sale was not material to the Company’s results of operations or financial position.
Impairments
During 2017, Wyndham Hotels recorded $41 million of non-cash impairment charges, of which $25 million was for a write-down of a guarantee asset and a development advance note receivable related to a hotel management agreement, and $16 million was primarily related to a partial write-down of management agreement assets. Such amount was recorded within impairment expense on the Consolidated and Combined Statements of Income.
Other Charges
During 2017, Wyndham Hotels recorded a $20 million write-down of property and equipment related to damage sustained from Hurricane Maria at its owned Rio Mar hotel in Puerto Rico. The property damage was fully recoverable through insurance coverage.
During 2016, Wyndham Hotels recorded a $7 million charge related to the termination of a management contract. Such loss was recorded within operating expenses on the Consolidated and Combined Statements of Income.
Restructuring
During 2017, Wyndham Hotels recorded $1 million of charges related to restructuring initiatives, primarily focused on realigning its brand operations. These initiatives resulted in a reduction of 12 employees. During 2017, Wyndham Hotels made $1 million of cash payments related to this initiative.
During 2016, Wyndham Hotels recorded $2 million of charges related to restructuring initiatives, primarily focused on enhancing organizational efficiency. These initiatives resulted in a reduction of 60 employees. During 2017, the Company paid its remaining liability with $1 million of cash payments.
| |
17. | Transactions with Former Parent |
Wyndham Hotels has a number of existing arrangements whereby former Parent has provided services to Wyndham Hotels.
Cash Management
Former Parent used a centralized cash management process. Prior to the Distribution, the majority of Wyndham Hotels’ daily cash receipts were transferred to former Parent and former Parent funded Wyndham Hotels’ operating and investing activities as needed. Accordingly, the cash and cash equivalents held by former Parent were not allocated to Wyndham Hotels prior to the Distribution. During such periods, Wyndham Hotels reflected transfers of cash between the Company and former Parent as a component of Due to former Parent, net on its Consolidated and Combined Balance Sheets.
Net Transfer to and Net Contribution from Former Parent
The components of net transfers to and net contribution from former Parent in the Consolidated and Combined Statements of former Parent’s Net Investment were as follows:
|
| | | | | | | | | | | |
| Year Ended December 31, |
| 2018 | | 2017 | | 2016 |
Cash pooling and general financing activities | $ | (110 | ) | | $ | (227 | ) | | $ | (390 | ) |
Indirect general corporate overhead allocations | 12 |
| | 35 |
| | 34 |
|
Corporate allocations for shared services | 13 |
| | 29 |
| | 29 |
|
Stock-based compensation allocations | 20 |
| | 11 |
| | 10 |
|
Income taxes | 27 |
| | 93 |
| | 78 |
|
Net transfers to former Parent | (38 | ) | | (59 | ) | | (239 | ) |
| | | | | |
Contribution of subsidiary borrowings due to former Parent | 197 |
| | — |
| | — |
|
Capital contribution from former Parent | 106 |
| | — |
| | — |
|
Dividend to former Parent | (109 | ) | | — |
| | — |
|
Other contributions from former Parent, net | 66 |
| | — |
| | — |
|
Net transfers to and net contribution from former Parent | $ | 222 |
| | $ | (59 | ) | | $ | (239 | ) |
Debt Due to Former Parent
Wyndham Hotels had $184 million of outstanding borrowings from its former Parent as of December 31, 2017. See Note 12 - Long-Term Debt and Borrowing Arrangements for further detail.
Services Provided by Former Parent
Prior to the Distribution, Wyndham Hotels’ Consolidated and Combined Financial Statements include costs for services that its former Parent provided to the Company, including, but not limited to, information technology support, financial services, human resources and other shared services. Historically, these costs were charged to Wyndham Hotels on a basis determined by its former Parent to reflect a reasonable allocation of actual costs incurred to perform the services. During 2018, 2017 and 2016, Wyndham Hotels was charged $13 million, $29 million and $29 million, respectively, for such services, which were included in Operating and General and administrative expenses in Wyndham Hotels’ Consolidated and Combined Statements of Income.
Additionally, former Parent allocated indirect general corporate overhead costs to Wyndham Hotels for certain functions and services provided, including, but not limited to, executive facilities, shared service technology platforms, finance and other administrative support. Accordingly, the Company recorded $12 million, $35 million and $34 million of expenses for
indirect general corporate overhead from former Parent during 2018, 2017 and 2016, respectively, which are included in General and administrative expenses within its Consolidated and Combined Statements of Income.
These allocations may not, however, reflect the expense Wyndham Hotels would have incurred as an independent, publicly traded company for the periods presented. Actual costs that may have been incurred had Wyndham Hotels been a stand-alone company would depend on a number of factors, including the chosen organizational structure, the functions Wyndham Hotels might have performed itself or outsourced and strategic decisions Wyndham Hotels might have made in areas such as information technology and infrastructure. Following the Distribution, Wyndham Hotels will perform these functions using its own resources or purchased services from either former Parent or third parties. For an interim period some of these functions will continue to be provided by former Parent under a transition services agreement.
Insurance
Prior to the Distribution, former Parent provided the Company with insurance coverage for general liability, property, business interruption and other risks with respect to business operations and charged the Company a fee based on estimates of claims. Wyndham Hotels was charged $1 million, $3 million and $3 million for insurance during 2018, 2017 and 2016, respectively, which was included in the Consolidated and Combined Statements of Income.
Defined Contribution Benefit Plans
Prior to the Distribution, former Parent administered and maintained defined contribution savings plans and a deferred compensation plan that provided eligible employees of Wyndham Hotels an opportunity to accumulate funds for retirement. Former Parent matched the contributions of participating employees on the basis specified by each plan. Wyndham Hotels’ cost for these plans was $2 million, $6 million and $5 million during 2018, 2017 and 2016, respectively.
Subsequent to the Distribution, Wyndham Hotels administers and maintains its own defined contribution savings plans and deferred compensation plan. The Company’s cost for these plans was $4 million during 2018.
Transactions with Former Parent
In connection with the Distribution, Wyndham Hotels and Wyndham Worldwide entered into long-term exclusive license agreements to retain Wyndham Destinations’ affiliations with one of the hospitality industry’s top-rated loyalty programs, Wyndham Rewards, as well as to continue to collaborate on inventory-sharing and customer cross-sell initiatives.
Wyndham Hotels also entered into several agreements with Wyndham Destinations that govern the relationship of the parties following the spin-off, including a separation and distribution agreement, an employee matters agreement, a tax matters agreement and a transition services agreement. In connection with these agreements, the Company recorded $7 million of revenues during 2018, which are reported within Corporate and Other.
In addition, Wyndham Hotels recorded revenues from Wyndham Destinations in the amount of $84 million, $59 million and $56 million for a license, development and non-competition agreement and $21 million, $16 million and $9 million for activities associated with the Wyndham Rewards program during 2018, 2017 and 2016, respectively. Such fees are recorded within License and other fees on the Consolidated and Combined Statements of Income.
These agreements have either not existed historically, or may be on different terms than the terms of the arrangement or agreements that existed prior to the spin-off. These Consolidated and Combined Financial Statements do not reflect the effect of these new and/or revised agreements for periods prior to the Distribution.
| |
18. | Quarterly Financial Data (Unaudited) |
Provided below are selected unaudited quarterly financial data for the periods ended:
|
| | | | | | | | | | | | | | | | |
| | 2018 |
| | March 31 | | June 30 | | September 30 | | December 31 |
Net Revenues | | | | | | | |
| Hotel Franchising | $ | 203 |
| | $ | 289 |
| | $ | 348 |
| | 295 |
|
| Hotel Management | 99 |
| | 146 |
| | 252 |
| | 229 |
|
| Corporate and Other | — |
| | — |
| | 4 |
| | 3 |
|
| Total Company | 302 |
| | 435 |
| | 604 |
| | 527 |
|
Total expenses | 246 |
| | 396 |
| | 499 |
| | 445 |
|
Operating income | 56 |
| | 39 |
| | 105 |
| | 82 |
|
Interest expense, net | 1 |
| | 10 |
| | 24 |
| | 25 |
|
Income before income taxes | 55 |
| | 29 |
| | 81 |
| | 57 |
|
Provision for income taxes | 16 |
| | 8 |
| | 23 |
| | 14 |
|
Net income | $ | 39 |
| | $ | 21 |
| | $ | 58 |
| | $ | 43 |
|
| | | | | | | |
Diluted earnings per share | $ | 0.40 |
| | $ | 0.21 |
| | $ | 0.58 |
| | $ | 0.43 |
|
Diluted weighted average shares outstanding | 99.8 |
| | 100.0 |
| | 100.1 |
| | 99.2 |
|
| | | | | | | |
Reconciliation of Net income to Adjusted EBITDA |
Net income | $ | 39 |
| | $ | 21 |
| | $ | 58 |
| | $ | 43 |
|
| Provision for income taxes | 16 |
| | 8 |
| | 23 |
| | 14 |
|
| Depreciation and amortization | 19 |
| | 22 |
| | 30 |
| | 29 |
|
| Interest expense, net | 1 |
| | 10 |
| | 24 |
| | 25 |
|
| Stock-based compensation | 3 |
| | 1 |
| | 3 |
| | 2 |
|
| Separation-related expenses | 12 |
| | 35 |
| | 17 |
| | 14 |
|
| Transaction-related expenses, net | 2 |
| | 28 |
| | 7 |
| | (1 | ) |
| Foreign currency impact of highly inflationary countries | — |
| | — |
| | 4 |
| | (1 | ) |
Adjusted EBITDA | $ | 92 |
| | $ | 125 |
| | $ | 166 |
| | $ | 125 |
|
| | | | | | | | |
Adjusted EBITDA by segment |
| Hotel Franchising | $ | 86 |
| | $ | 129 |
| | $ | 178 |
| | 122 |
|
| Hotel Management | 16 |
| | 8 |
| | 5 |
| | 18 |
|
| Corporate and Other | (10 | ) | | (12 | ) | | (17 | ) | | (15 | ) |
| Total Adjusted EBITDA | $ | 92 |
| | $ | 125 |
| | $ | 166 |
| | $ | 125 |
|
|
| | | | | | | | | | | | | | | | |
| | 2017 |
| | March 31 | | June 30 | | September 30 | | December 31 |
Net Revenues | | | | | | | |
| Hotel Franchising | $ | 191 |
| | $ | 233 |
| | $ | 258 |
| | $ | 215 |
|
| Hotel Management | 98 |
| | 98 |
| | 89 |
| | 97 |
|
| Corporate and Other | — |
| | — |
| | — |
| | — |
|
| Total Company | 289 |
| | 331 |
| | 347 |
| | 312 |
|
Total expenses | 232 |
| | 247 |
| | 245 |
| | 304 |
|
Operating income | 57 |
| | 84 |
| | 102 |
| | 8 |
|
Interest expense, net | 2 |
| | 2 |
| | 2 |
| | 1 |
|
Income before income taxes | 55 |
| | 82 |
| | 100 |
| | 7 |
|
Provision for income taxes (a) | 22 |
| | 34 |
| | 42 |
| | (85 | ) |
Net income | $ | 33 |
| | $ | 48 |
| | $ | 58 |
| | $ | 92 |
|
| | | | | | | | |
Diluted earnings per share | $ | 0.33 |
| | $ | 0.48 |
| | $ | 0.58 |
| | $ | 0.92 |
|
Diluted weighted average shares outstanding | 99.8 |
| | 99.8 |
| | 99.8 |
| | 99.8 |
|
| | | | | | | | |
Reconciliation of Net income to Adjusted EBITDA |
Net Income | $ | 33 |
| | $ | 48 |
| | $ | 58 |
| | $ | 92 |
|
| Provision for income taxes (a) | 22 |
| | 34 |
| | 42 |
| | (85 | ) |
| Depreciation and amortization | 18 |
| | 19 |
| | 19 |
| | 19 |
|
| Interest expense, net | 2 |
| | 2 |
| | 2 |
| | 1 |
|
| Stock-based compensation | 2 |
| | 2 |
| | 2 |
| | 3 |
|
| Separation-related expenses | — |
| | — |
| | — |
| | 3 |
|
| Transaction-related expenses, net | — |
| | — |
| | 1 |
| | 2 |
|
| Impairment expense | — |
| | — |
| | — |
| | 41 |
|
| Restructuring | 1 |
| | — |
| | — |
| | — |
|
Adjusted EBITDA | $ | 78 |
| | $ | 105 |
| | $ | 124 |
| | $ | 76 |
|
| | | | | | | | |
Adjusted EBITDA by segment | | | | | | | |
| Hotel Franchising | $ | 78 |
| | $ | 111 |
| | $ | 132 |
| | $ | 81 |
|
| Hotel Management | 9 |
| | 4 |
| | 1 |
| | 6 |
|
| Corporate and Other | (9 | ) | | (10 | ) | | (9 | ) | | (11 | ) |
| Total Adjusted EBITDA | $ | 78 |
| | $ | 105 |
| | $ | 124 |
| | $ | 76 |
|
______________________
| |
(a) | The Provision for income taxes for the three months ended December 31, 2017, reflects the benefit from U.S tax reform of $85 million. See Note 8 - Income Taxes for more information. |
Exhibit Index
|
| |
Exhibit No. | Description |
2.1 | |
2.2 | |
3.1 | |
3.2 | |
4.1 | |
4.2 | |
4.3 | |
4.4 | |
4.5 | |
10.1 | |
10.2 | |
10.3 | |
10.4 | License, Development and Noncompetition Agreement, dated as of May 31, 2018, among Wyndham Destinations, Inc., Wyndham Hotels and Resorts, LLC, Wyndham Hotels & Resorts, Inc., Wyndham Hotel Group Europe Limited, Wyndham Hotel Hong Kong Co. Limited, and Wyndham Hotel Asia Pacific Co. Limited (incorporated by reference to Exhibit 10.4 to the Registrant’s Form 8-K filed June 4, 2018) |
10.5 | Credit Agreement, dated as of May 30, 2018, among Wyndham Hotels & Resorts, Inc., the guarantors party thereto from time to time, Bank of America, N.A., as Administrative and Collateral Agent, and the lenders party thereto (incorporated by reference to Exhibit 10.1 to the Registrant’s Form 8-K filed May 31, 2018) |
10.6 | |
10.7 | |
10.8 | |
10.9 | |
10.10 | |
10.11 | |
10.12 | |
10.13 | |
|
| |
10.14 | |
10.15 | |
10.16 | |
10.17 | |
10.18 | |
10.19* | |
10.20* | |
10.21* | |
21.1* | |
23.1* | |
31.1* | |
31.2* | |
32** | |
101.INS* | XBRL Instance Document |
101.SCH* | XBRL Taxonomy Extension Schema Document |
101.CAL* | XBRL Taxonomy Extension Calculation Linkbase Document |
101.DEF* | XBRL Taxonomy Extension Definition Linkbase Document |
101.LAB* | XBRL Taxonomy Extension Label Linkbase Document |
101.PRE* | XBRL Taxonomy Extension Presentation Linkbase Document |
______________________
* Filed herewith.
** Furnished with this report.