false2021FY0001722684P3YP3YP1YP1YP1YP1YP1YP1YP1YP1YP1YP1YP1YP1YP1YP1YP1YP7Y5005.375http://fasb.org/us-gaap/2021-01-31#OtherAssetsNoncurrenthttp://fasb.org/us-gaap/2021-01-31#OtherAssetsNoncurrenthttp://fasb.org/us-gaap/2021-01-31#PropertyPlantAndEquipmentNethttp://fasb.org/us-gaap/2021-01-31#PropertyPlantAndEquipmentNethttp://fasb.org/us-gaap/2021-01-31#AccruedLiabilitiesCurrenthttp://fasb.org/us-gaap/2021-01-31#AccruedLiabilitiesCurrenthttp://fasb.org/us-gaap/2021-01-31#Liabilitieshttp://fasb.org/us-gaap/2021-01-31#Liabilitieshttp://fasb.org/us-gaap/2021-01-31#AccruedLiabilitiesCurrenthttp://fasb.org/us-gaap/2021-01-31#AccruedLiabilitiesCurrenthttp://fasb.org/us-gaap/2021-01-31#OtherLiabilitiesNoncurrenthttp://fasb.org/us-gaap/2021-01-31#OtherLiabilitiesNoncurrenthttp://fasb.org/us-gaap/2021-01-31#OtherLiabilitiesNoncurrenthttp://fasb.org/us-gaap/2021-01-31#OtherLiabilitiesNoncurrent00017226842021-01-012021-12-3100017226842021-06-30iso4217:USD00017226842022-01-31xbrli:shares0001722684wh:RoyaltiesandFranchiseFeesMember2021-01-012021-12-310001722684wh:RoyaltiesandFranchiseFeesMember2020-01-012020-12-310001722684wh:RoyaltiesandFranchiseFeesMember2019-01-012019-12-310001722684wh:MarketingReservationandLoyaltyMember2021-01-012021-12-310001722684wh:MarketingReservationandLoyaltyMember2020-01-012020-12-310001722684wh:MarketingReservationandLoyaltyMember2019-01-012019-12-310001722684wh:HotelManagementServicesMember2021-01-012021-12-310001722684wh:HotelManagementServicesMember2020-01-012020-12-310001722684wh:HotelManagementServicesMember2019-01-012019-12-310001722684wh:LicenseandOtherFeeFromFormerParentMember2021-01-012021-12-310001722684wh:LicenseandOtherFeeFromFormerParentMember2020-01-012020-12-310001722684wh:LicenseandOtherFeeFromFormerParentMember2019-01-012019-12-310001722684wh:OtherProductsandServicesMember2021-01-012021-12-310001722684wh:OtherProductsandServicesMember2020-01-012020-12-310001722684wh:OtherProductsandServicesMember2019-01-012019-12-3100017226842020-01-012020-12-3100017226842019-01-012019-12-310001722684wh:CostReimbursementsMember2021-01-012021-12-310001722684wh:CostReimbursementsMember2020-01-012020-12-310001722684wh:CostReimbursementsMember2019-01-012019-12-31iso4217:USDxbrli:shares0001722684us-gaap:AccumulatedOtherComprehensiveIncomeMember2021-01-012021-12-3100017226842021-12-3100017226842020-12-310001722684us-gaap:TrademarksMember2021-12-310001722684us-gaap:TrademarksMember2020-12-310001722684wh:FranchiseAgreementsAndOtherIntangibleAssetsMember2021-12-310001722684wh:FranchiseAgreementsAndOtherIntangibleAssetsMember2020-12-3100017226842019-12-3100017226842018-12-310001722684us-gaap:CommonStockMember2018-12-310001722684us-gaap:TreasuryStockMember2018-12-310001722684us-gaap:AdditionalPaidInCapitalMember2018-12-310001722684us-gaap:RetainedEarningsAppropriatedMember2018-12-310001722684us-gaap:AccumulatedOtherComprehensiveIncomeMember2018-12-310001722684us-gaap:RetainedEarningsAppropriatedMember2019-01-012019-12-310001722684us-gaap:AccumulatedOtherComprehensiveIncomeMember2019-01-012019-12-310001722684us-gaap:CommonStockMember2019-01-012019-12-310001722684us-gaap:TreasuryStockMember2019-01-012019-12-310001722684us-gaap:AdditionalPaidInCapitalMember2019-01-012019-12-310001722684us-gaap:CommonStockMember2019-12-310001722684us-gaap:TreasuryStockMember2019-12-310001722684us-gaap:AdditionalPaidInCapitalMember2019-12-310001722684us-gaap:RetainedEarningsAppropriatedMember2019-12-310001722684us-gaap:AccumulatedOtherComprehensiveIncomeMember2019-12-310001722684us-gaap:RetainedEarningsAppropriatedMember2020-01-012020-12-310001722684us-gaap:AccumulatedOtherComprehensiveIncomeMember2020-01-012020-12-310001722684us-gaap:CommonStockMember2020-01-012020-12-310001722684us-gaap:TreasuryStockMember2020-01-012020-12-310001722684us-gaap:AdditionalPaidInCapitalMember2020-01-012020-12-310001722684us-gaap:RetainedEarningsAppropriatedMembersrt:CumulativeEffectPeriodOfAdoptionAdjustmentMember2020-01-010001722684srt:CumulativeEffectPeriodOfAdoptionAdjustmentMember2020-01-010001722684us-gaap:CommonStockMember2020-12-310001722684us-gaap:TreasuryStockMember2020-12-310001722684us-gaap:AdditionalPaidInCapitalMember2020-12-310001722684us-gaap:RetainedEarningsAppropriatedMember2020-12-310001722684us-gaap:AccumulatedOtherComprehensiveIncomeMember2020-12-310001722684us-gaap:RetainedEarningsAppropriatedMember2021-01-012021-12-310001722684us-gaap:CommonStockMember2021-01-012021-12-310001722684us-gaap:TreasuryStockMember2021-01-012021-12-310001722684us-gaap:AdditionalPaidInCapitalMember2021-01-012021-12-310001722684us-gaap:CommonStockMember2021-12-310001722684us-gaap:TreasuryStockMember2021-12-310001722684us-gaap:AdditionalPaidInCapitalMember2021-12-310001722684us-gaap:RetainedEarningsAppropriatedMember2021-12-310001722684us-gaap:AccumulatedOtherComprehensiveIncomeMember2021-12-31wh:countrywh:hotel0001722684wh:LoyaltyProgramMember2021-12-310001722684wh:LoyaltyProgramMember2020-12-310001722684wh:LoyaltyProgramMember2020-01-012020-12-310001722684us-gaap:BuildingMember2021-01-012021-12-310001722684wh:BuildingAndLeaseholdImprovementsMember2021-01-012021-12-310001722684srt:MinimumMemberus-gaap:FurnitureAndFixturesMember2021-01-012021-12-310001722684us-gaap:FurnitureAndFixturesMembersrt:MaximumMember2021-01-012021-12-310001722684srt:MinimumMemberus-gaap:SoftwareAndSoftwareDevelopmentCostsMember2021-01-012021-12-310001722684srt:MaximumMemberus-gaap:SoftwareAndSoftwareDevelopmentCostsMember2021-01-012021-12-310001722684us-gaap:SoftwareAndSoftwareDevelopmentCostsMember2021-12-310001722684us-gaap:SoftwareAndSoftwareDevelopmentCostsMember2020-12-310001722684srt:MinimumMember2021-01-012021-12-310001722684srt:MaximumMember2021-01-012021-12-310001722684wh:InitialFranchiseFeesMember2021-12-310001722684wh:InitialFranchiseFeesMember2020-12-310001722684us-gaap:ProductAndServiceOtherMember2021-12-310001722684us-gaap:ProductAndServiceOtherMember2020-12-3100017226842022-01-01wh:InitialFranchiseFeesMember2021-12-310001722684wh:InitialFranchiseFeesMember2023-01-012021-12-310001722684wh:InitialFranchiseFeesMember2024-01-012021-12-310001722684wh:InitialFranchiseFeesMember2025-01-012021-12-3100017226842022-01-01wh:LoyaltyProgramMember2021-12-310001722684wh:LoyaltyProgramMember2023-01-012021-12-310001722684wh:LoyaltyProgramMember2024-01-012021-12-310001722684wh:LoyaltyProgramMember2025-01-012021-12-3100017226842022-01-01wh:OtherProductsandServicesMember2021-12-310001722684wh:OtherProductsandServicesMember2023-01-012021-12-310001722684wh:OtherProductsandServicesMember2024-01-012021-12-310001722684wh:OtherProductsandServicesMember2025-01-012021-12-310001722684wh:OtherProductsandServicesMember2021-12-3100017226842022-01-012021-12-3100017226842023-01-012021-12-3100017226842024-01-012021-12-3100017226842025-01-012021-12-310001722684wh:HotelFranchisingSegmentMemberwh:RoyaltiesandFranchiseFeesMember2021-01-012021-12-310001722684wh:HotelFranchisingSegmentMemberwh:RoyaltiesandFranchiseFeesMember2020-01-012020-12-310001722684wh:HotelFranchisingSegmentMemberwh:RoyaltiesandFranchiseFeesMember2019-01-012019-12-310001722684wh:MarketingReservationandLoyaltyMemberwh:HotelFranchisingSegmentMember2021-01-012021-12-310001722684wh:MarketingReservationandLoyaltyMemberwh:HotelFranchisingSegmentMember2020-01-012020-12-310001722684wh:MarketingReservationandLoyaltyMemberwh:HotelFranchisingSegmentMember2019-01-012019-12-310001722684wh:LicenseandOtherFeeFromFormerParentMemberwh:HotelFranchisingSegmentMember2021-01-012021-12-310001722684wh:LicenseandOtherFeeFromFormerParentMemberwh:HotelFranchisingSegmentMember2020-01-012020-12-310001722684wh:LicenseandOtherFeeFromFormerParentMemberwh:HotelFranchisingSegmentMember2019-01-012019-12-310001722684wh:OtherProductsandServicesMemberwh:HotelFranchisingSegmentMember2021-01-012021-12-310001722684wh:OtherProductsandServicesMemberwh:HotelFranchisingSegmentMember2020-01-012020-12-310001722684wh:OtherProductsandServicesMemberwh:HotelFranchisingSegmentMember2019-01-012019-12-310001722684wh:HotelFranchisingSegmentMemberus-gaap:OperatingSegmentsMember2021-01-012021-12-310001722684wh:HotelFranchisingSegmentMemberus-gaap:OperatingSegmentsMember2020-01-012020-12-310001722684wh:HotelFranchisingSegmentMemberus-gaap:OperatingSegmentsMember2019-01-012019-12-310001722684wh:HotelManagementSegmentMemberwh:RoyaltiesandFranchiseFeesMember2021-01-012021-12-310001722684wh:HotelManagementSegmentMemberwh:RoyaltiesandFranchiseFeesMember2020-01-012020-12-310001722684wh:HotelManagementSegmentMemberwh:RoyaltiesandFranchiseFeesMember2019-01-012019-12-310001722684wh:MarketingReservationandLoyaltyMemberwh:HotelManagementSegmentMember2021-01-012021-12-310001722684wh:MarketingReservationandLoyaltyMemberwh:HotelManagementSegmentMember2020-01-012020-12-310001722684wh:MarketingReservationandLoyaltyMemberwh:HotelManagementSegmentMember2019-01-012019-12-310001722684wh:OwnedHotelRevenuesMemberwh:HotelManagementSegmentMember2021-01-012021-12-310001722684wh:OwnedHotelRevenuesMemberwh:HotelManagementSegmentMember2020-01-012020-12-310001722684wh:OwnedHotelRevenuesMemberwh:HotelManagementSegmentMember2019-01-012019-12-310001722684wh:HotelManagementSegmentMemberwh:ManagedHotelRevenuesMember2021-01-012021-12-310001722684wh:HotelManagementSegmentMemberwh:ManagedHotelRevenuesMember2020-01-012020-12-310001722684wh:HotelManagementSegmentMemberwh:ManagedHotelRevenuesMember2019-01-012019-12-310001722684wh:HotelManagementSegmentMemberwh:CostReimbursementsMember2021-01-012021-12-310001722684wh:HotelManagementSegmentMemberwh:CostReimbursementsMember2020-01-012020-12-310001722684wh:HotelManagementSegmentMemberwh:CostReimbursementsMember2019-01-012019-12-310001722684wh:OtherProductsandServicesMemberwh:HotelManagementSegmentMember2021-01-012021-12-310001722684wh:OtherProductsandServicesMemberwh:HotelManagementSegmentMember2020-01-012020-12-310001722684wh:OtherProductsandServicesMemberwh:HotelManagementSegmentMember2019-01-012019-12-310001722684wh:HotelManagementSegmentMemberus-gaap:OperatingSegmentsMember2021-01-012021-12-310001722684wh:HotelManagementSegmentMemberus-gaap:OperatingSegmentsMember2020-01-012020-12-310001722684wh:HotelManagementSegmentMemberus-gaap:OperatingSegmentsMember2019-01-012019-12-310001722684us-gaap:CorporateNonSegmentMember2021-01-012021-12-310001722684us-gaap:CorporateNonSegmentMember2020-01-012020-12-310001722684us-gaap:CorporateNonSegmentMember2019-01-012019-12-310001722684us-gaap:OtherCurrentAssetsMember2021-12-310001722684us-gaap:OtherCurrentAssetsMember2020-12-310001722684us-gaap:OtherNoncurrentAssetsMember2021-12-310001722684us-gaap:OtherNoncurrentAssetsMember2020-12-310001722684wh:HotelManagementServicesMember2022-01-012021-12-310001722684wh:HotelManagementServicesMember2023-01-012021-12-310001722684wh:HotelManagementServicesMember2024-01-012021-12-310001722684wh:HotelManagementServicesMember2025-01-012021-12-310001722684srt:CumulativeEffectPeriodOfAdoptionAdjustmentMemberus-gaap:AccountingStandardsUpdate201613Member2020-01-010001722684srt:CumulativeEffectPeriodOfAdoptionAdjustmentMemberus-gaap:AccountingStandardsUpdate201613Member2020-01-012020-01-010001722684srt:CumulativeEffectPeriodOfAdoptionAdjustmentMemberus-gaap:AccountingStandardsUpdate201613Member2019-12-310001722684wh:FinancingReceivablewithDeferredIncomeOffsetMember2021-12-310001722684wh:FinancingReceivablewithDeferredIncomeOffsetMember2020-12-310001722684wh:HotelManagementSegmentMember2021-01-012021-12-310001722684us-gaap:LandMember2021-12-310001722684us-gaap:LandMember2020-12-310001722684us-gaap:BuildingAndBuildingImprovementsMember2021-12-310001722684us-gaap:BuildingAndBuildingImprovementsMember2020-12-310001722684us-gaap:ComputerEquipmentMember2021-12-310001722684us-gaap:ComputerEquipmentMember2020-12-310001722684us-gaap:FurnitureAndFixturesMember2021-12-310001722684us-gaap:FurnitureAndFixturesMember2020-12-310001722684us-gaap:OtherCapitalizedPropertyPlantAndEquipmentMember2021-12-310001722684us-gaap:OtherCapitalizedPropertyPlantAndEquipmentMember2020-12-310001722684us-gaap:ConstructionInProgressMember2021-12-310001722684us-gaap:ConstructionInProgressMember2020-12-310001722684wh:SeniorUnsecuredNotesdueApril2026Member2020-08-310001722684us-gaap:SeniorNotesMemberwh:SeniorUnsecuredNotesdueApril2026Member2018-04-30xbrli:pure0001722684wh:ImpairedAssetsMember2020-04-012020-06-3000017226842020-04-012020-06-3000017226842021-04-012021-06-300001722684wh:ImpairedAssetsMemberwh:OwnedHotelReportingUnitMember2020-06-300001722684wh:ImpairedAssetsMemberwh:LaQuintatrademarkMember2020-06-300001722684wh:ImpairedAssetsMemberwh:LaQuintatrademarkMember2020-04-012020-06-300001722684wh:ImpairedAssetsMemberwh:OtherimpairedtrademarksMember2020-06-300001722684wh:ImpairedAssetsMemberwh:OtherimpairedtrademarksMember2020-04-012020-06-300001722684wh:ImpairedAssetsMember2020-06-3000017226842020-06-30wh:trademark0001722684us-gaap:TrademarksMember2021-12-310001722684us-gaap:TrademarksMember2020-12-310001722684us-gaap:FranchiseRightsMember2021-12-310001722684us-gaap:FranchiseRightsMember2020-12-310001722684wh:ManagementAgreementsMember2021-12-310001722684wh:ManagementAgreementsMember2020-12-310001722684us-gaap:TrademarksMember2021-12-310001722684us-gaap:TrademarksMember2020-12-310001722684us-gaap:OtherIntangibleAssetsMember2021-12-310001722684us-gaap:OtherIntangibleAssetsMember2020-12-310001722684wh:HotelFranchisingSegmentMember2019-12-310001722684wh:HotelFranchisingSegmentMember2020-01-012020-12-310001722684wh:HotelFranchisingSegmentMember2021-12-310001722684wh:HotelManagementSegmentMember2019-12-310001722684wh:HotelManagementSegmentMember2020-01-012020-12-310001722684wh:HotelManagementSegmentMember2021-12-310001722684us-gaap:FranchiseRightsMember2021-01-012021-12-310001722684us-gaap:FranchiseRightsMember2020-01-012020-12-310001722684us-gaap:FranchiseRightsMember2019-01-012019-12-310001722684wh:ManagementAgreementsMember2021-01-012021-12-310001722684wh:ManagementAgreementsMember2020-01-012020-12-310001722684wh:ManagementAgreementsMember2019-01-012019-12-310001722684us-gaap:OtherIntangibleAssetsMember2021-01-012021-12-310001722684us-gaap:OtherIntangibleAssetsMember2020-01-012020-12-310001722684us-gaap:OtherIntangibleAssetsMember2019-01-012019-12-310001722684us-gaap:FranchiseMember2021-01-012021-12-310001722684us-gaap:FranchiseMember2020-01-012020-12-310001722684us-gaap:FranchiseMember2019-01-012019-12-310001722684wh:FranchiseesAndHotelOwnersMember2021-12-310001722684wh:FranchiseesAndHotelOwnersMember2020-12-310001722684wh:ForgivenessOfNoteReceivableMember2021-01-012021-12-310001722684wh:ForgivenessOfNoteReceivableMember2020-01-012020-12-310001722684wh:ForgivenessOfNoteReceivableMember2019-01-012019-12-310001722684wh:DeferredIncomeTaxesMember2021-12-310001722684wh:DeferredIncomeTaxesMember2020-12-310001722684wh:NetOperatingLossCarryforwardMember2021-12-310001722684wh:DeferredTaxAssetMember2021-12-310001722684wh:ForeignTaxCreditMember2021-12-310001722684wh:NetOperatingLossCarryforwardMember2020-12-310001722684wh:DeferredTaxAssetMember2020-12-310001722684wh:ForeignTaxCreditMember2020-12-310001722684srt:MinimumMemberus-gaap:DomesticCountryMember2021-12-310001722684us-gaap:DomesticCountryMembersrt:MaximumMember2021-12-310001722684wh:LaQuintaHoldingsInc.Memberwh:DomesticandStateandLocalAuthorityMember2019-01-012019-12-310001722684us-gaap:RevolvingCreditFacilityMemberus-gaap:LineOfCreditMember2021-12-310001722684us-gaap:RevolvingCreditFacilityMemberus-gaap:LineOfCreditMember2020-12-310001722684wh:TermLoandue2025Memberus-gaap:LongTermDebtMember2021-12-310001722684wh:TermLoandue2025Memberus-gaap:LongTermDebtMember2020-12-310001722684us-gaap:SeniorNotesMemberwh:SeniorUnsecuredNotesdueApril2026Member2021-12-310001722684us-gaap:SeniorNotesMemberwh:SeniorUnsecuredNotesdueApril2026Member2020-12-310001722684us-gaap:SeniorNotesMemberwh:SeniorUnsecuredNotesDueAugust2028Member2021-12-310001722684us-gaap:SeniorNotesMemberwh:SeniorUnsecuredNotesDueAugust2028Member2020-12-310001722684us-gaap:CapitalLeaseObligationsMemberwh:WyndhamWorldwideMember2021-12-310001722684us-gaap:CapitalLeaseObligationsMemberwh:WyndhamWorldwideMember2020-12-310001722684wh:TermLoanandSeniorUnsecuredNotesMember2021-12-310001722684wh:TermLoanandSeniorUnsecuredNotesMember2020-12-310001722684us-gaap:RevolvingCreditFacilityMember2021-12-310001722684us-gaap:RevolvingCreditFacilityMember2018-05-310001722684srt:MinimumMemberus-gaap:RevolvingCreditFacilityMember2018-05-012018-05-310001722684us-gaap:RevolvingCreditFacilityMembersrt:MaximumMember2018-05-012018-05-310001722684srt:MinimumMemberus-gaap:LondonInterbankOfferedRateLIBORMemberus-gaap:RevolvingCreditFacilityMember2018-05-012018-05-310001722684us-gaap:LondonInterbankOfferedRateLIBORMemberus-gaap:RevolvingCreditFacilityMembersrt:MaximumMember2018-05-012018-05-310001722684us-gaap:RevolvingCreditFacilityMember2018-05-012018-05-310001722684us-gaap:RevolvingCreditFacilityMember2020-04-300001722684wh:TermLoandue2025Memberus-gaap:LongTermDebtMember2018-05-310001722684us-gaap:BaseRateMemberwh:TermLoandue2025Member2018-05-012018-05-310001722684us-gaap:LondonInterbankOfferedRateLIBORMemberwh:TermLoandue2025Member2018-05-012018-05-310001722684wh:TermLoandue2025Member2018-05-012018-05-310001722684wh:CreditAgreementMember2018-05-310001722684wh:CreditAgreementMember2018-05-312018-05-310001722684wh:SeniorUnsecuredNotesdueApril2026Member2018-04-012018-04-300001722684wh:SeniorUnsecuredNotesdueApril2026Member2021-04-150001722684us-gaap:SeniorNotesMemberwh:SeniorUnsecuredNotesdueApril2026Member2021-04-150001722684wh:SeniorUnsecuredNotesdueApril2026Member2021-04-012021-06-300001722684us-gaap:SeniorNotesMemberwh:SeniorUnsecuredNotesDueAugust2028Member2020-08-310001722684wh:SeniorUnsecuredNotesDueAugust2028Member2020-08-310001722684wh:SeniorUnsecuredNotesDueAugust2028Member2020-08-012020-08-310001722684us-gaap:RevolvingCreditFacilityMember2020-12-310001722684us-gaap:InterestRateSwapMember2018-05-310001722684wh:InterestRateSwap1Member2018-05-310001722684srt:WeightedAverageMemberwh:InterestRateSwap1Member2021-12-310001722684wh:InterestRateSwap2Member2018-05-310001722684srt:WeightedAverageMemberwh:InterestRateSwap2Member2021-12-310001722684us-gaap:InterestRateSwapMember2021-01-012021-12-310001722684us-gaap:InterestRateSwapMember2020-01-012020-12-310001722684us-gaap:InterestRateSwapMember2019-01-012019-12-310001722684us-gaap:CarryingReportedAmountFairValueDisclosureMember2021-12-310001722684us-gaap:EstimateOfFairValueFairValueDisclosureMember2021-12-310001722684stpr:TXus-gaap:SalesRevenueNetMemberus-gaap:CustomerConcentrationRiskMember2021-01-012021-12-310001722684stpr:FLus-gaap:SalesRevenueNetMemberus-gaap:CustomerConcentrationRiskMember2021-01-012021-12-310001722684stpr:TXus-gaap:SalesRevenueNetMemberus-gaap:CustomerConcentrationRiskMember2020-01-012020-12-310001722684stpr:FLus-gaap:SalesRevenueNetMemberus-gaap:CustomerConcentrationRiskMember2020-01-012020-12-310001722684stpr:TXus-gaap:SalesRevenueNetMemberus-gaap:CustomerConcentrationRiskMember2019-01-012019-12-310001722684stpr:FLus-gaap:SalesRevenueNetMemberus-gaap:CustomerConcentrationRiskMember2019-01-012019-12-310001722684stpr:FL2021-01-012021-12-310001722684stpr:FL2020-01-012020-12-310001722684stpr:FL2019-01-012019-12-310001722684wh:CorePointMemberus-gaap:SalesRevenueNetMemberus-gaap:CustomerConcentrationRiskMember2021-01-012021-12-310001722684wh:CorePointMemberus-gaap:SalesRevenueNetMemberus-gaap:CustomerConcentrationRiskMember2020-01-012020-12-310001722684wh:CorePointMemberus-gaap:SalesRevenueNetMemberus-gaap:CustomerConcentrationRiskMember2019-01-012019-12-310001722684wh:CorePointMemberwh:RevenueExcludingCostReimbursementsBenchmarkMemberus-gaap:CustomerConcentrationRiskMember2021-01-012021-12-310001722684wh:CorePointMemberwh:RevenueExcludingCostReimbursementsBenchmarkMemberus-gaap:CustomerConcentrationRiskMember2019-01-012019-12-310001722684wh:CorePointMemberwh:RevenueExcludingCostReimbursementsBenchmarkMemberus-gaap:CustomerConcentrationRiskMember2020-01-012020-12-310001722684srt:MaximumMember2021-12-310001722684us-gaap:ContractTerminationMemberus-gaap:AccountsReceivableMember2020-04-012020-06-300001722684us-gaap:PaymentGuaranteeMember2021-12-310001722684wh:FairValueOfGuaranteesMember2021-12-310001722684wh:GuaranteeReceivableFromFormerParentMember2021-12-310001722684wh:GuaranteeReceivableFromFormerParentMember2020-12-310001722684wh:WyndhamHotelsResortsInc.2018EquityandIncentivePlanMember2018-05-140001722684wh:WyndhamHotelsResortsInc.2018EquityandIncentivePlanMember2021-12-310001722684us-gaap:RestrictedStockUnitsRSUMember2020-12-310001722684us-gaap:PerformanceSharesMember2020-12-310001722684us-gaap:RestrictedStockUnitsRSUMember2021-01-012021-12-310001722684us-gaap:PerformanceSharesMember2021-01-012021-12-310001722684us-gaap:RestrictedStockUnitsRSUMember2021-12-310001722684us-gaap:PerformanceSharesMember2021-12-310001722684us-gaap:EmployeeStockOptionMember2021-01-012021-12-310001722684us-gaap:RestructuringChargesMember2020-01-012020-12-310001722684us-gaap:RestructuringChargesMember2019-01-012019-12-310001722684wh:SeparationRelatedCostsMember2019-01-012019-12-310001722684us-gaap:CorporateAndOtherMember2021-01-012021-12-310001722684wh:HotelFranchisingSegmentMemberus-gaap:OperatingSegmentsMember2021-12-310001722684wh:HotelManagementSegmentMemberus-gaap:OperatingSegmentsMember2021-12-310001722684us-gaap:AllOtherSegmentsMember2021-12-310001722684us-gaap:CorporateAndOtherMember2020-01-012020-12-310001722684wh:HotelFranchisingSegmentMemberus-gaap:OperatingSegmentsMember2020-12-310001722684wh:HotelManagementSegmentMemberus-gaap:OperatingSegmentsMember2020-12-310001722684us-gaap:AllOtherSegmentsMember2020-12-310001722684us-gaap:CorporateAndOtherMember2019-01-012019-12-310001722684wh:HotelFranchisingSegmentMemberus-gaap:OperatingSegmentsMember2019-12-310001722684wh:HotelManagementSegmentMemberus-gaap:OperatingSegmentsMember2019-12-310001722684us-gaap:AllOtherSegmentsMember2019-12-310001722684wh:NonseparationrelatedMemberwh:WyndhamHotelsResortsInc.2018EquityandIncentivePlanMember2020-01-012020-12-310001722684wh:NonseparationrelatedMemberwh:WyndhamHotelsResortsInc.2018EquityandIncentivePlanMember2019-01-012019-12-310001722684country:US2021-01-012021-12-310001722684us-gaap:NonUsMember2021-01-012021-12-310001722684country:US2021-12-310001722684us-gaap:NonUsMember2021-12-310001722684country:US2020-01-012020-12-310001722684us-gaap:NonUsMember2020-01-012020-12-310001722684country:US2020-12-310001722684us-gaap:NonUsMember2020-12-310001722684country:US2019-01-012019-12-310001722684us-gaap:NonUsMember2019-01-012019-12-310001722684country:US2019-12-310001722684us-gaap:NonUsMember2019-12-310001722684us-gaap:ContractTerminationMemberus-gaap:AccountsReceivableMember2020-01-012020-12-310001722684wh:PreviouslyimpairedassetMember2020-01-012020-12-310001722684us-gaap:ContractTerminationMemberus-gaap:FinanceReceivablesMember2019-01-012019-12-310001722684us-gaap:ContractTerminationMemberus-gaap:OtherAssetsMember2019-01-012019-12-310001722684us-gaap:ContractTerminationMemberus-gaap:OtherLiabilitiesMember2019-01-012019-12-310001722684us-gaap:EmployeeSeveranceMemberwh:A2020RestructuringPlansMember2020-12-310001722684us-gaap:EmployeeSeveranceMemberwh:A2020RestructuringPlansMember2021-01-012021-12-310001722684us-gaap:EmployeeSeveranceMemberwh:A2020RestructuringPlansMember2021-12-310001722684us-gaap:FacilityClosingMemberwh:A2020RestructuringPlansMember2020-12-310001722684us-gaap:FacilityClosingMemberwh:A2020RestructuringPlansMember2021-01-012021-12-310001722684us-gaap:FacilityClosingMemberwh:A2020RestructuringPlansMember2021-12-310001722684wh:A2020RestructuringPlansMember2020-12-310001722684wh:A2020RestructuringPlansMember2021-01-012021-12-310001722684wh:A2020RestructuringPlanMember2020-01-012020-12-31wh:employee0001722684wh:A2019RestructuringPlanMember2019-12-310001722684wh:A2019RestructuringPlanMember2020-01-012020-12-310001722684wh:A2019RestructuringPlanMember2020-12-310001722684us-gaap:EmployeeSeveranceMemberwh:A2020RestructuringPlansMember2019-12-310001722684us-gaap:EmployeeSeveranceMemberwh:A2020RestructuringPlansMember2020-01-012020-12-310001722684us-gaap:FacilityClosingMemberwh:A2020RestructuringPlansMember2019-12-310001722684us-gaap:FacilityClosingMemberwh:A2020RestructuringPlansMember2020-01-012020-12-310001722684wh:A2020RestructuringPlansMemberus-gaap:OtherRestructuringMember2019-12-310001722684wh:A2020RestructuringPlansMemberus-gaap:OtherRestructuringMember2020-01-012020-12-310001722684wh:A2020RestructuringPlansMemberus-gaap:OtherRestructuringMember2020-12-310001722684wh:A2020RestructuringPlansMember2019-12-310001722684wh:A2020RestructuringPlansMember2020-01-012020-12-310001722684wh:CorePointtaxmatterMember2019-01-012019-12-310001722684us-gaap:ContractTerminationMember2019-01-012019-12-310001722684wh:ContractTerminationOtherMember2019-01-012019-12-310001722684wh:ContractTerminationIndemnificationObligationMember2019-01-012019-12-3100017226842019-07-012019-09-300001722684wh:SeparationAndDistributionAgreementMembersrt:AffiliatedEntityMember2021-01-012021-12-310001722684wh:SeparationAndDistributionAgreementMembersrt:AffiliatedEntityMember2020-01-012020-12-310001722684wh:SeparationAndDistributionAgreementMembersrt:AffiliatedEntityMember2019-01-012019-12-310001722684wh:WyndhamWorldwideMemberus-gaap:LicensingAgreementsMember2021-01-012021-12-310001722684wh:WyndhamWorldwideMemberus-gaap:LicensingAgreementsMember2020-01-012020-12-310001722684wh:WyndhamWorldwideMemberus-gaap:LicensingAgreementsMember2019-01-012019-12-310001722684wh:WyndhamRewardsMembersrt:AffiliatedEntityMember2021-01-012021-12-310001722684wh:WyndhamRewardsMembersrt:AffiliatedEntityMember2020-01-012020-12-310001722684wh:WyndhamRewardsMembersrt:AffiliatedEntityMember2019-01-012019-12-310001722684srt:AffiliatedEntityMemberus-gaap:LicensingAgreementsMember2021-01-012021-12-310001722684srt:AffiliatedEntityMemberus-gaap:LicensingAgreementsMember2020-01-012020-12-310001722684srt:AffiliatedEntityMemberus-gaap:LicensingAgreementsMember2019-01-012019-12-310001722684srt:AffiliatedEntityMemberwh:ContractTerminationIndemnificationObligationMember2019-01-012019-12-310001722684us-gaap:OtherNoncurrentLiabilitiesMember2021-12-310001722684us-gaap:OtherNoncurrentLiabilitiesMember2020-12-310001722684us-gaap:OtherCurrentLiabilitiesMember2021-12-310001722684us-gaap:OtherCurrentLiabilitiesMember2020-12-310001722684srt:AffiliatedEntityMemberus-gaap:OtherAssetsMember2019-01-012019-12-310001722684srt:AffiliatedEntityMemberwh:SaleofEuropeanVacationRentalsBusinessMember2019-01-012019-12-310001722684srt:AffiliatedEntityMemberwh:SaleofEuropeanVacationRentalsBusinessMember2021-12-310001722684us-gaap:AccumulatedTranslationAdjustmentMember2018-12-310001722684us-gaap:AccumulatedNetGainLossFromDesignatedOrQualifyingCashFlowHedgesMember2018-12-310001722684us-gaap:AccumulatedTranslationAdjustmentMember2019-01-012019-12-310001722684us-gaap:AccumulatedNetGainLossFromDesignatedOrQualifyingCashFlowHedgesMember2019-01-012019-12-310001722684us-gaap:AccumulatedTranslationAdjustmentMember2019-12-310001722684us-gaap:AccumulatedNetGainLossFromDesignatedOrQualifyingCashFlowHedgesMember2019-12-310001722684us-gaap:AccumulatedNetGainLossFromDesignatedOrQualifyingCashFlowHedgesMember2020-01-012020-12-310001722684us-gaap:AccumulatedTranslationAdjustmentMember2020-12-310001722684us-gaap:AccumulatedNetGainLossFromDesignatedOrQualifyingCashFlowHedgesMember2020-12-310001722684us-gaap:AccumulatedTranslationAdjustmentMember2021-12-310001722684us-gaap:AccumulatedNetGainLossFromDesignatedOrQualifyingCashFlowHedgesMember2021-12-310001722684wh:WyndhamHotelsDefinedContributionPlansMember2020-01-012020-12-310001722684wh:WyndhamHotelsDefinedContributionPlansMember2019-01-012019-12-310001722684wh:WyndhamHotelsDefinedContributionPlansMember2021-01-012021-12-31
UNITED STATES
SECURITIES AND EXCHANGE COMMISSION
WASHINGTON, D.C. 20549
FORM 10-K
☑ ANNUAL REPORT PURSUANT TO SECTION 13 OR 15(d) OF THE SECURITIES EXCHANGE ACT OF 1934
For the fiscal year ended December 31, 2021
or
☐ TRANSITION REPORT PURSUANT TO SECTION 13 OR 15(d) OF THE SECURITIES EXCHANGE ACT OF 1934
For the transition period from to
Commission file number 001-38432
Wyndham Hotels & Resorts, Inc.
(Exact Name of Registrant as Specified in Its Charter)
| | | | | | | | | | | |
Delaware | | 82-3356232 |
(State or Other Jurisdiction of Incorporation or Organization) | | (I.R.S. Employer Identification No.) |
| | | |
22 Sylvan Way | | 07054 |
Parsippany, | New Jersey | | (Zip Code) |
(Address of Principal Executive Offices) | | |
(973) 753-6000
(Registrant’s telephone number, including area code)
Securities registered pursuant to Section 12(b) of the Act:
| | | | | | | | |
Title of each class | Trading Symbol(s) | Name of each exchange on which registered |
Common Stock, Par Value $0.01 per share | WH | New York Stock Exchange |
Securities registered pursuant to Section 12(g) of the Act:
None
(Title of Class)
Indicate by check mark if the registrant is a well-known seasoned issuer, as defined in Rule 405 of the Securities Act. Yes ☑ No ☐
Indicate by check mark if the registrant is not required to file reports pursuant to Section 13 or Section 15(d) of the Act. Yes ☐ No ☑
Indicate by check mark whether the registrant (1) has filed all reports required to be filed by Section 13 or 15(d) of the Securities Exchange Act of 1934 during the preceding 12 months (or for such shorter period that the registrant was required to file such reports), and (2) has been subject to such filing requirements for the past 90 days. Yes ☑ No ☐
Indicate by check mark whether the registrant has submitted electronically every Interactive Data File required to be submitted pursuant to Rule 405 of Regulation S-T (§232.405 of this chapter) during the preceding 12 months (or for such shorter period that the registrant was required to submit such files). Yes ☑ No ☐
Indicate by check mark whether the registrant is a large accelerated filer, an accelerated filer, a non-accelerated filer, smaller reporting company, or an emerging growth company. See the definitions of “large accelerated filer,” “accelerated filer,” “smaller reporting company,” and “emerging growth company” in Rule 12b-2 of the Exchange Act.
| | | | | | | | | | | | | | | | | | | | | | | |
Large accelerated filer | ☑ | | | | | Accelerated filer | ☐ |
Non-accelerated filer | ☐ | | | | | Smaller reporting company | ☐ |
| | | | | | Emerging growth company | ☐ |
If an emerging growth company, indicate by check mark if the registrant has elected not to use the extended transition period for complying with any new or revised financial accounting standards provided pursuant to Section 13(a) of the Exchange Act. ☐
Indicate by check mark whether the registrant has filed a report on and attestation to its management’s assessment of the effectiveness of its internal control over financial reporting under Section 404(b) of the Sarbanes-Oxley Act (15 U.S.C. 7262(b)) by the registered public accounting firm that prepared or issued its audit report. ☑
Indicate by check mark whether the registrant is a shell company (as defined in Rule 12b-2 of the Exchange Act). Yes ☐ No ☑
The aggregate market value of the registrant’s common stock held by non-affiliates of the registrant as of June 30, 2021, was $6.70 billion. All executive officers and directors of the registrant have been deemed, solely for the purpose of the foregoing calculation, to be “affiliates” of the registrant.
As of January 31, 2022, the registrant had outstanding 92,305,604 shares of common stock.
DOCUMENTS INCORPORATED BY REFERENCE
Portions of the Proxy Statement prepared for the 2022 Annual Meeting of Stockholders are incorporated by reference into Part III of this report.
TABLE OF CONTENTS
| | | | | | | | |
| | Page |
| PART I | |
| Item 1. | | |
| Item 1A. | | |
| Item 1B. | | |
| Item 2. | | |
| Item 3. | | |
| Item 4. | | |
| | |
| PART II | |
| Item 5. | | |
| Item 6. | | |
| Item 7. | | |
| Item 7A. | | |
| Item 8. | | |
| Item 9. | | |
| Item 9A. | | |
| Item 9B. | | |
| Item 9C. | | |
| | |
| PART III | |
| Item 10. | | |
| Item 11. | | |
| Item 12. | | |
| Item 13. | | |
| Item 14. | | |
| | |
| PART IV | |
| Item 15. | | |
| Item 16. | | |
| | |
PART I
Forward-Looking Statements
This Annual Report on Form 10-K (this “Annual Report” or “report”) contains forward-looking statements within the meaning of Section 21E of the Securities Exchange Act of 1934, as amended. These statements include, but are not limited to, statements related to our views and expectations regarding our strategy and the performance of our business, our financial results, our liquidity and capital resources and other non-historical statements. Forward-looking statements include those that convey management’s expectations as to the future based on plans, estimates and projections and may be identified by words such as “will,” “expect,” “believe,” “plan,” “anticipate,” “intend,” “goal,” “future,” “outlook,” “guidance,” “target,” “objective,” “estimate,” “projection” and similar words or expressions, including the negative version of such words and expressions. Such forward-looking statements involve known and unknown risks, uncertainties and other factors, which may cause the actual results, performance or achievements of the Company to be materially different from any future results, performance or achievements expressed or implied by such forward-looking statements. You are cautioned not to place undue reliance on these forward-looking statements, which speak only as of the date of this report.
Factors that could cause actual results to differ materially from those in the forward-looking statements include without limitation general economic conditions; the continuation or worsening of the effects from the coronavirus pandemic, (“COVID-19”); its scope, duration, resurgence and impact on our business operations, financial results, cash flows and liquidity, as well as the impact on our franchisees and property owners, guests and team members, the hospitality industry and overall demand for and restrictions on travel; the success of our mitigation efforts in response to COVID-19; our continued performance during the recovery from COVID-19, and any resurgence or mutations of the virus; various actions governments, businesses and individuals continue to take in response to the pandemic, including stay-in-place directives (including, for instance, quarantine and isolation guidelines and mandates), safety mitigation guidance, as well as the timing, availability and adoption rates of vaccinations, booster shots and other treatments for COVID-19; concerns with or threats of other pandemics, contagious diseases or health epidemics, including the effects of COVID-19; the performance of the financial and credit markets; the economic environment for the hospitality industry; operating risks associated with the hotel franchising and management businesses; our relationships with franchisees and property owners; the impact of war, terrorist activity, political instability or political strife; risks related to restructuring or strategic initiatives; risks related to our relationship with CorePoint Lodging Inc. (“CorePoint”) and our relationship with Highgate Holdings, Inc. and certain of its affiliates or subsidiaries (collectively referred to herein as “Highgate”) following the closing of CorePoint’s sale; the Company’s ability to satisfy obligations and agreements under its outstanding indebtedness, including the payment of principal and interest and compliance with the covenants thereunder; risks related to our ability to obtain financing and the terms of such financing, including access to liquidity and capital; and the Company’s ability to make or pay, plans for, and the timing and amount of any future share repurchases and/or dividends, as well as the risks described under Part I, Item 1A – Risk Factors.
Where You Can Find More Information
We file annual, quarterly and current reports, proxy statements, reports that are filed or furnished pursuant to Section 13(a) or 15(d) of the Securities Exchange Act of 1934 and other information with the Securities and Exchange Commission (“SEC”). Our SEC filings are available free of charge to the public over the Internet at the SEC’s website at https://www.sec.gov. Our SEC filings are also available on our website at https://www.wyndhamhotels.com as soon as reasonably practicable after they are filed with or furnished to the SEC. We maintain an internet site at https://www.wyndhamhotels.com. Our website and the information contained on or connected to that site are not incorporated into this Annual Report.
We may use our website as a means of disclosing material non-public information and for complying with our disclosure obligations under Regulation FD. Disclosures of this nature will be included on our website in the “Investors” section, which can currently be accessed at www.investor.wyndhamhotels.com. Accordingly, investors should monitor this section of our website in addition to following our press releases, filings submitted with the SEC and any public conference calls or webcasts.
Item 1. Business.
Wyndham Hotels & Resorts, Inc. (“Wyndham Hotels”, the “Company”, “we”, “our” or “us”) is the world’s largest hotel franchising company by number of hotels, with approximately 9,000 affiliated hotels with over 810,000 rooms located in approximately 95 countries and welcoming over 120 million guests annually worldwide. We operate a hotel portfolio of 22 brands, including two new brands introduced in 2021, Registry Collection Hotels, our first luxury brand, and Wyndham Alltra our first all-inclusive brand. Our 22 brands are primarily located in secondary and tertiary cities and approximately
80% of the U.S. population lives within ten miles of at least one of our affiliated hotels. Our mission is to make hotel travel possible for all. Wherever people go, Wyndham will be there to welcome them. We boast a remarkably asset-light business model with only two of our 9,000 hotels being owned, dramatically limiting our capital needs and our exposure to the rising wage environment.
During 2020, the hotel industry experienced a sharp decline in travel demand due to COVID-19 and the related government preventative and protective actions to slow the spread of the virus, including travel restrictions. We and the entire industry experienced significant revenue losses in 2020 as a result of steep RevPAR declines. Yet, the impact on our business was mitigated by characteristics unique to our business model. With approximately 70% of bookings at our hotels being leisure-oriented, our hotel owners are less reliant on business travel, which only makes up approximately 30% of bookings. Within this business segment, corporate transient and group bookings are the smallest component, where less than 5% of our bookings come from this segment. Our business customers are substantially comprised of truckers, contractors, construction workers, utility crews and others whose office is the road and who do not have the ability to conduct their work remotely. These customers provide a steady state of business for the majority of our hotel owners and in fact, our infrastructure accounts, which represent 70% of the domestic business demand that our brands drive, contributed 10% more revenue to our U.S. hotels during the second half of 2021 than the same period in 2019, a trend that we see continuing given the passage of President Biden’s infrastructure bill late last year. In addition, nearly 90% of hotels within our U.S. system are located along highways and in suburban and small metro areas, on the way to or near outdoor destinations such as national parks and beach communities. Our hotels are in locations that travelers felt safe visiting and we invested in sales and marketing efforts to reach travel seekers and instill confidence that our hotels were clean, safe and welcoming guests. Finally, over 95% of our U.S. business is originated domestically. As a result, our platform was naturally set up to capture returning demand throughout the pandemic and the recovery and our business was able to substantially recover from COVID’s impact during 2021.
Our economy and midscale brands in the U.S. have outperformed the industry’s higher-end chain scales consistently since the onset of the pandemic and have led the industry’s recovery in 2021. Our RevPAR recovered to 97% of 2019 levels in the U.S. International recovery has trailed the U.S. due to a heavier reliance on cross boarder travel and localized travel restrictions at various points throughout the year. However, we have experienced significant improvement over the last few quarters and international RevPAR, on a constant currency basis, has recovered to 78% of its pre-pandemic levels during the second half of 2021 compared to 56% in the first half of this year. Our 2021 adjusted EBITDA recovered to 95% of 2019 levels.
The Company does not anticipate the pandemic to further materially impact the results from operations, however should there be a resurgence of COVID-19, our results of operations may be negatively impacted and certain intangible assets, such as our trademarks, and our franchised and managed goodwill may be exposed to impairments. For further discussion on the effect of COVID-19 on our financial condition and liquidity, see Part II, Item 7. Management’s Discussion and Analysis of Financial Condition and Results of Operations.
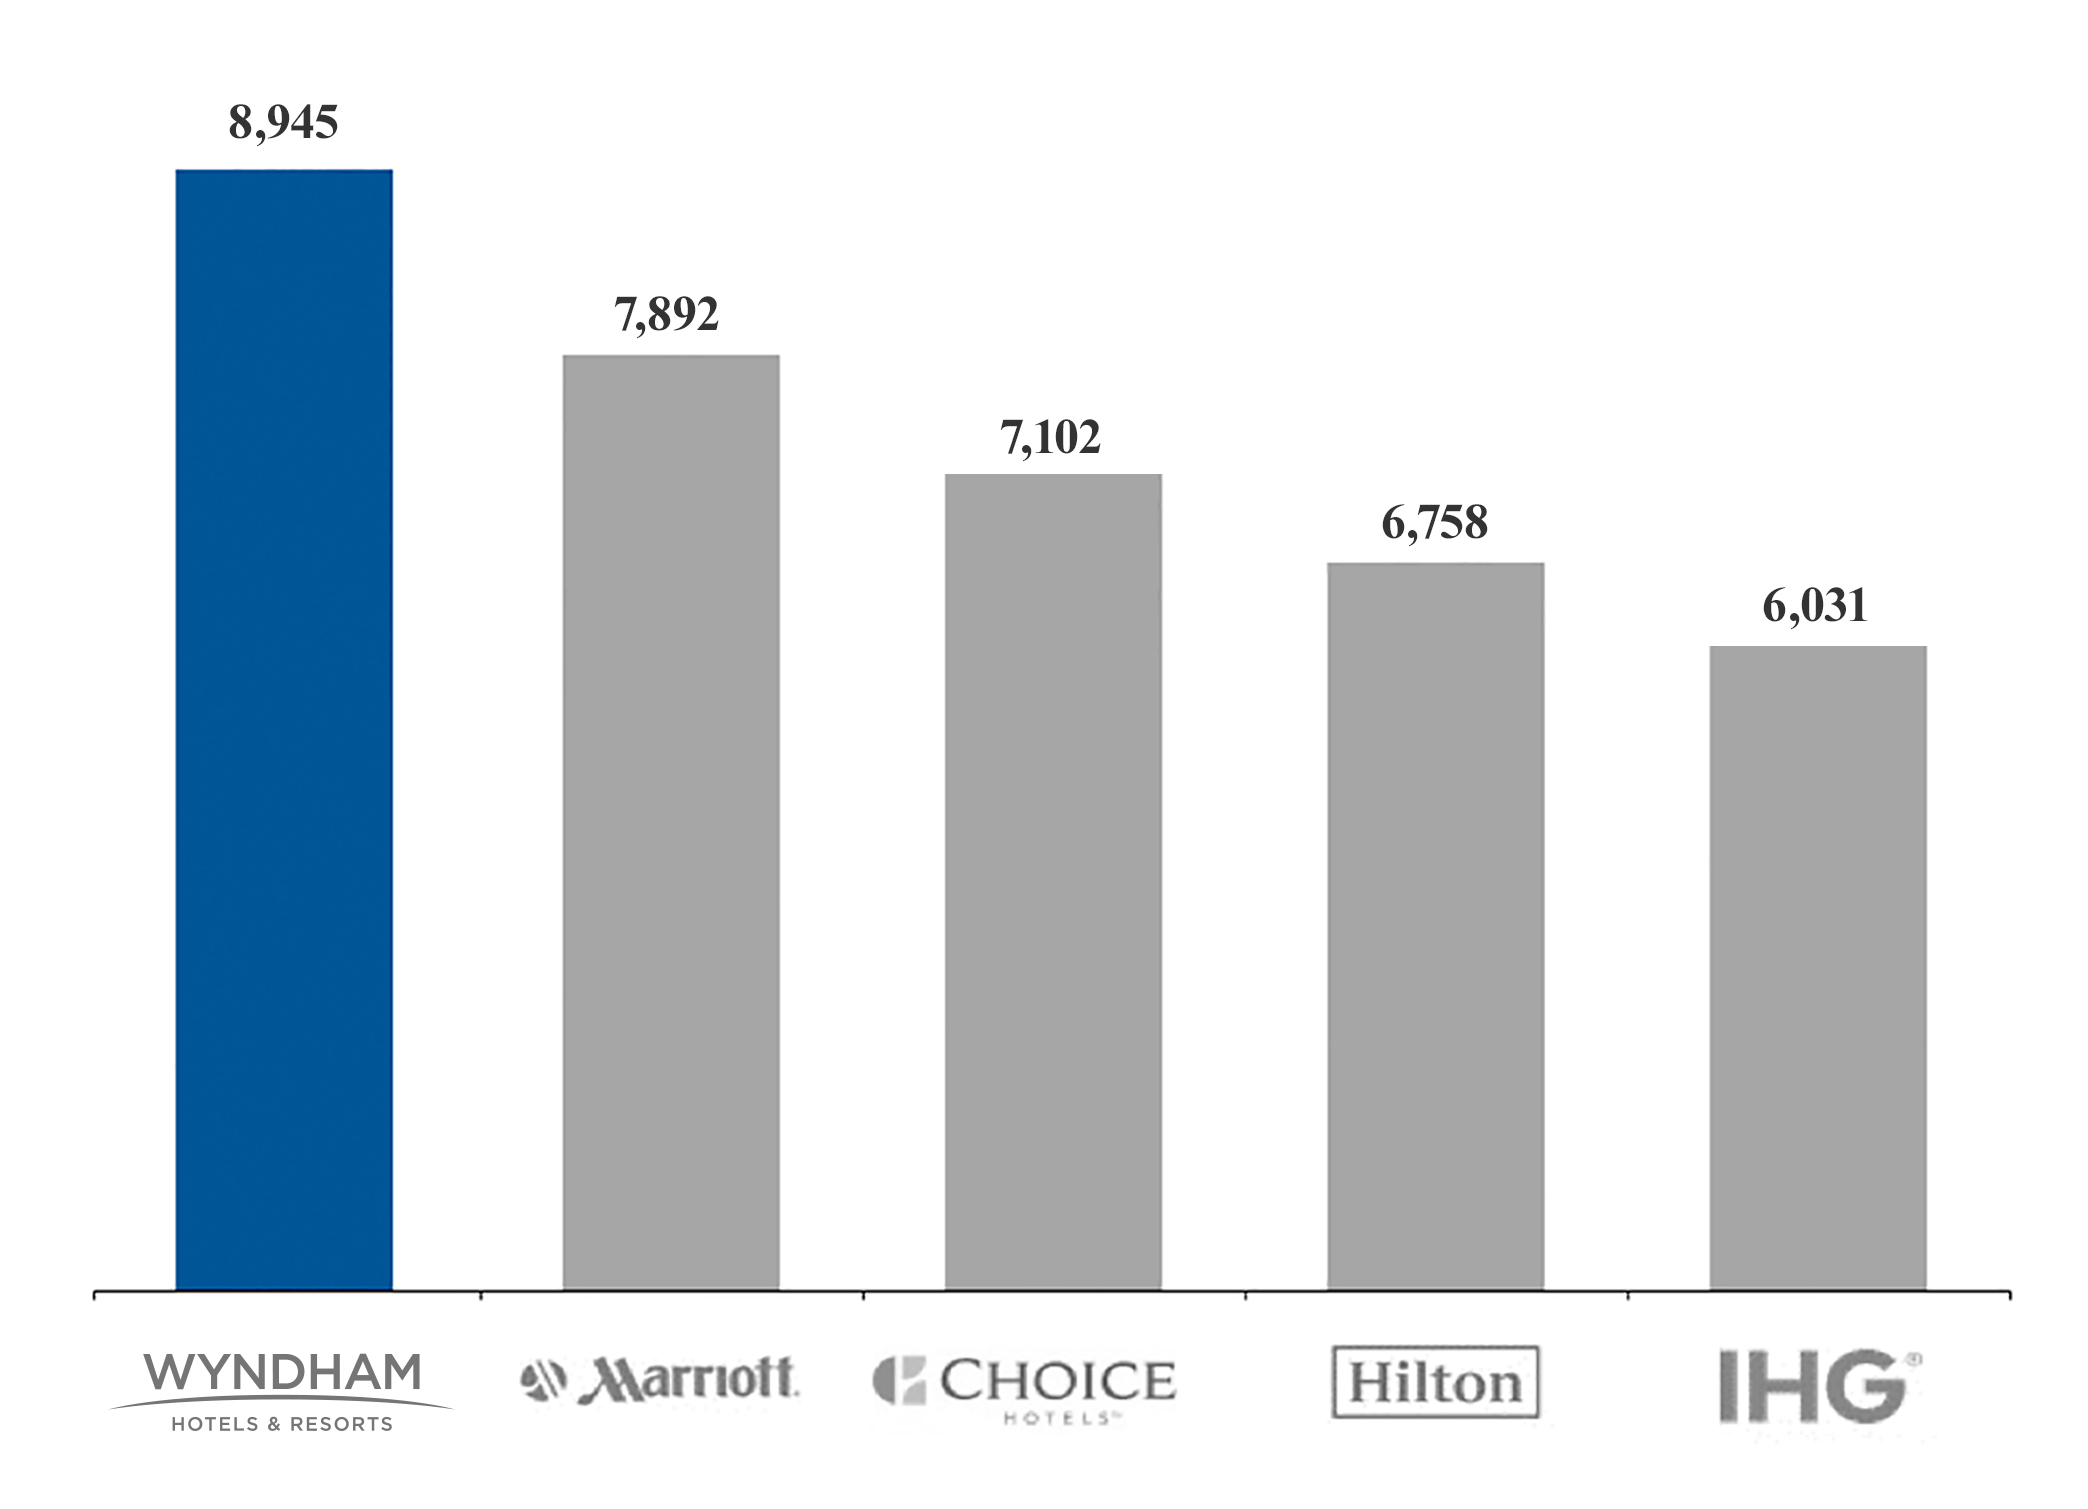
The following chart presents the number of branded hotels associated with each of the five largest traditional hotel franchise companies as of September 30, 2021:
Source: Companies’ public disclosures
Our widely recognized brands with select-service focus offer a breadth of options for franchisees and a wide range of price points and experiences for our guests. We are a global leader in the economy and midscale chain scales where our brands represent over 30% of branded rooms in the United States, and also have a strong presence in the upper midscale chain scale.
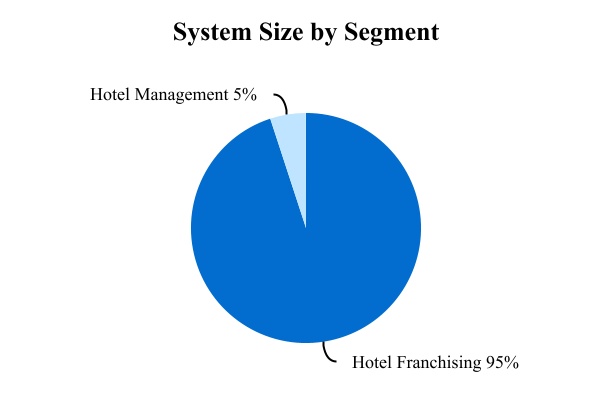
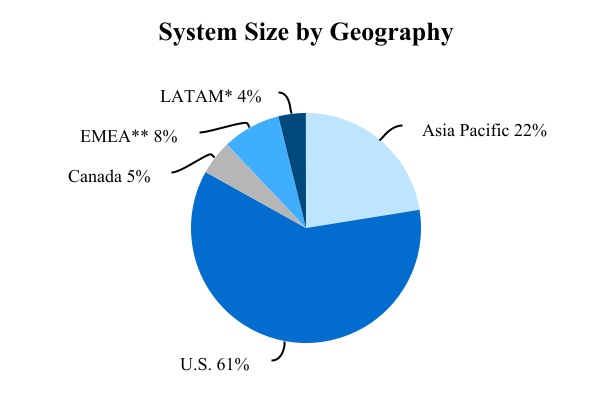
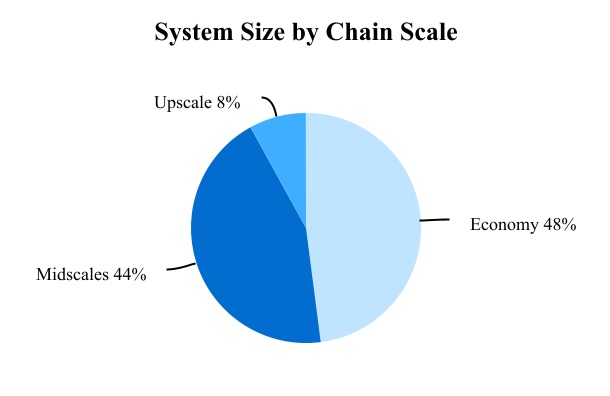
The following charts illustrate our system size (by rooms) as of December 31, 2021:
______________________
* LATAM is representative of Latin America and the Caribbean.
** EMEA is representative of Europe, the Middle East, Eurasia and Africa.
As of December 31, 2021, our brand portfolio consisted of the following:
| | | | | | | | | | | | | | | | | | | | | | | | | | | | | | | | | | | | | | | | | | | | | | | | | | | | | |
| Global Full Year RevPAR | | | | North America | | Asia Pacific | | | | | | |
| | | | U.S. | | Canada | | Greater China | | Rest of Asia | | EMEA | | LATAM | | Total |
| Economy | | | | | | | | | | | | | | | | | |
| Super 8 | $ | 28.41 | | | Properties | | 1,486 | | 119 | | 1,077 | | — | | | 11 | | — | | | 2,693 |
| | | Rooms | | 88,992 | | 7,758 | | 65,395 | | — | | | 1,862 | | — | | | 164,007 |
| Days Inn | $ | 36.60 | | | Properties | | 1,326 | | 108 | | 49 | | 14 | | 54 | | 8 | | 1,559 |
| | | Rooms | | 97,015 | | 8,476 | | 7,749 | | 1,999 | | 3,174 | | 687 | | 119,100 |
| Travelodge | $ | 35.42 | | | Properties | | 352 | | 101 | | — | | | — | | | — | | | — | | | 453 |
| | | Rooms | | 23,866 | | 8,107 | | — | | | — | | | — | | | — | | | 31,973 |
| Microtel | $ | 42.30 | | | Properties | | 296 | | 23 | | 6 | | | 14 | | — | | | 8 | | 347 |
| | | Rooms | | 20,884 | | 1,955 | | 885 | | | 1,037 | | — | | | 955 | | 25,716 |
| Howard Johnson | $ | 25.61 | | | Properties | | 159 | | 18 | | 69 | | 2 | | 7 | | 44 | | 299 |
| | | Rooms | | 12,336 | | 1,250 | | 21,588 | | 1,902 | | 790 | | 2,797 | | 40,663 |
| Total Economy | $ | 32.24 | | | Properties | | 3,619 | | 369 | | 1,201 | | 30 | | 72 | | 60 | | 5,351 |
| | | Rooms | | 243,093 | | 27,546 | | 95,617 | | 4,938 | | 5,826 | | 4,439 | | 381,459 |
| Midscale | | | | | | | | | | | | | | | | | |
| La Quinta | $ | 56.37 | | | Properties | | 906 | | 2 | | — | | | 1 | | | 4 | | | 9 | | 922 |
| | | Rooms | | 87,950 | | 133 | | — | | | 188 | | | 765 | | | 1,062 | | 90,098 |
| Ramada | $ | 26.34 | | | Properties | | 317 | | 78 | | 136 | | 67 | | 223 | | 29 | | 850 |
| | | Rooms | | 37,186 | | 7,526 | | 28,231 | | 13,611 | | 30,338 | | 3,927 | | 120,819 |
| Baymont | $ | 39.79 | | | Properties | | 507 | | 5 | | — | | | — | | | — | | | 1 | | 513 |
| | | Rooms | | 38,687 | | 361 | | — | | | — | | | — | | | 118 | | 39,166 |
| AmericInn | $ | 52.28 | | | Properties | | 206 | | — | | | — | | | — | | | — | | | — | | | 206 |
| | | Rooms | | 12,099 | | — | | | — | | | — | | | — | | | — | | | 12,099 |
| Wingate | $ | 48.04 | | | Properties | | 164 | | 9 | | 5 | | — | | | — | | | 1 | | 179 |
| | | Rooms | | 14,793 | | 905 | | 799 | | — | | | — | | | 176 | | 16,673 |
| Wyndham Alltra | NM | | Properties | | — | | — | | — | | — | | — | | 2 | | 2 |
| | | Rooms | | — | | — | | — | | — | | — | | 745 | | 745 |
| Wyndham Garden | $ | 33.69 | | | Properties | | 66 | | 4 | | 19 | | 8 | | 20 | | 22 | | 139 |
| | | Rooms | | 10,798 | | 723 | | 4,040 | | 1,158 | | 3,236 | | 3,046 | | 23,001 |
| Ramada Encore | $ | 16.36 | | | Properties | | — | | | — | | | 25 | | 14 | | 22 | | 12 | | 73 |
| | | Rooms | | — | | | — | | | 3,701 | | 4,059 | | 2,593 | | 1,610 | | 11,963 |
| Hawthorn | $ | 51.44 | | | Properties | | 72 | | — | | | — | | | — | | | 5 | | — | | | 77 |
| | | Rooms | | 6,081 | | — | | | — | | | — | | | 504 | | — | | | 6,585 |
| Trademark Collection | $ | 40.64 | | | Properties | | 56 | | 11 | | — | | | 10 | | | 54 | | 14 | | | 145 |
| | | Rooms | | 9,097 | | 1,639 | | — | | | 307 | | | 9,166 | | 2,043 | | | 22,252 |
| TRYP | $ | 25.91 | | | Properties | | 8 | | — | | | 1 | | 1 | | 26 | | 18 | | 54 |
| | | Rooms | | 1,006 | | — | | | 95 | | 191 | | 3,746 | | 2,102 | | 7,140 |
| Total Midscale | $ | 39.08 | | | Properties | | 2,302 | | 109 | | 186 | | 101 | | 354 | | 108 | | 3,160 |
| | | Rooms | | 217,697 | | 11,287 | | 36,866 | | 19,514 | | 50,348 | | 14,829 | | 350,541 |
| Upscale | | | | | | | | | | | | | | | | | |
| Dazzler | $ | 13.65 | | | Properties | | — | | | — | | | — | | | — | | | — | | | 13 | | 13 |
| | | Rooms | | — | | | — | | | — | | | — | | | — | | | 1,738 | | 1,738 |
| Esplendor | $ | 14.64 | | | Properties | | — | | | — | | | — | | | — | | | — | | | 9 | | 9 |
| | | Rooms | | — | | | — | | | — | | | — | | | — | | | 806 | | 806 |
| Wyndham | $ | 35.67 | | | Properties | | 41 | | — | | | 35 | | 14 | | 22 | | 41 | | 153 |
| | | Rooms | | 11,064 | | — | | | 10,173 | | 2,642 | | 3,592 | | 9,236 | | 36,707 |
| Wyndham Grand | $ | 48.61 | | | Properties | | 10 | | — | | | 34 | | 6 | | 15 | | — | | | 65 |
| | | Rooms | | 3,009 | | — | | | 11,104 | | 1,542 | | 3,611 | | — | | | 19,266 |
| Dolce | $ | 71.91 | | | Properties | | 7 | | 3 | | | — | | 1 | | 9 | | — | | | 20 |
| | | Rooms | | 1,400 | | 276 | | — | | | 342 | | | 2,738 | | — | | | 4,756 |
| Total Upscale | $ | 41.90 | | | Properties | | 58 | | 3 | | 69 | | 21 | | 46 | | 63 | | 260 |
| | | Rooms | | 15,473 | | 276 | | 21,277 | | 4,526 | | 9,941 | | 11,780 | | 63,273 |
| Luxury | | | | | | | | | | | | | | | | | |
| Registry Collection | NM | | Properties | | — | | — | | | — | | — | | — | | 2 | | | 2 |
| | | Rooms | | — | | — | | | — | | — | | — | | 274 | | | 274 |
Affiliated properties (a) | | | | | | | | | | | | | | | | | |
| | | Properties | | 160 | | 3 | | — | | | 11 | | — | | | 3 | | 177 |
| | | Rooms | | 14,336 | | 44 | | — | | | 47 | | — | | | 77 | | 14,504 |
| Total | $ | 35.95 | | | Properties | | 6,139 | | 484 | | 1,456 | | 163 | | 472 | | 236 | | 8,950 |
| | | Rooms | | 490,599 | | 39,153 | | 153,760 | | 29,025 | | 66,115 | | 31,399 | | 810,051 |
______________________
(a)Affiliated properties represent properties under affiliation arrangements with former Parent or other third parties.
The following table presents the changes in our portfolio for the last three years:
| | | | | | | | | | | | | | | | | | | | | | | | | | | | | | | | | | | |
| As of December 31, |
| 2021 | | 2020 | | 2019 |
| Properties | | Rooms | | Properties | | Rooms | | Properties | | Rooms |
| Beginning balance | 8,941 | | | 795,900 | | | 9,280 | | | 831,000 | | | 9,157 | | | 809,900 | |
Additions | 415 | | | 53,100 | | | 322 | | | 35,600 | | | 523 | | | 63,500 | |
Deletions (a) | (406) | | | (38,900) | | | (661) | | | (70,700) | | | (400) | | | (42,400) | |
| Ending balance | 8,950 | | | 810,100 | | | 8,941 | | | 795,900 | | | 9,280 | | | 831,000 | |
______________________
(a)2020 includes the deletion of 214 properties and approximately 18,500 rooms from the termination of non-compliant and brand detracting rooms, 20 properties and approximately 2,900 unprofitable rooms in connection with a guaranteed management contract and three properties and approximately 5,300 low-royalty rooms in connection with hotel sales by a strategic partner.
In addition to our current hotel portfolio, we have over 1,500 properties and over 194,000 rooms in our development pipeline throughout 60 countries. As of December 31, 2021, approximately 35% of our pipeline was located in the U.S. and 65% was located internationally; 79% of our pipeline was for new construction properties, of which 35% have broken ground and 21%, represented conversion opportunities.
Our pipeline is typically only a subset of our development activity in any given period as some of our hotel additions are executed and opened in less than 90 days and therefore may never appear in our pipeline. However, we use the pipeline to gauge interest in our brands and our continued ability to drive our net room growth projections.
Our franchise sales team consists of nearly 130 sales professionals throughout the world. Our sales team is focused on growing our franchise business through conversions of existing branded and independent hotels and partnering with developers to brand newly constructed hotels. In addition to a regional presence in the United States, we currently have sales teams located in London, Istanbul, Dubai, China, Singapore, Canada, Delhi, Mexico City, Sao Paulo, Buenos Aires, Seoul and Australia. Our international presence in key countries allows us to quickly adapt to changes in the increasingly dynamic global marketplace and to capitalize on new opportunities as they emerge.
In 2021, our sales team executed 655 contracts representing over 82,000 rooms. A key component of driving our net room growth is our ability to retain properties within our system. Our 2021 global retention rate improved 35 basis points compared to 2019 to over 95% and our 2021 domestic retention rate was also over 95%, consistent with 2019. In 2020 we experienced some large, discrete non-recurring termination events depressing our retention rates:
•we removed 21,400 rooms primarily relating to master franchise agreements (18,500) and unprofitable hotel management guarantee agreements (2,900); and
•a strategic partner unexpectedly sold certain hotels, triggering termination of the underlying license agreement and the removal of 5,300 rooms.
Adjusting for these unusual termination events, our 2020 global and domestic retention rates would have been 95%. Our goal is to continue to improve our retention rate over time to support higher overall net room growth.
Our Guest Loyalty Program
Wyndham Rewards is our award-winning guest loyalty program that supports our portfolio of brands. The program generates significant repeat business by rewarding guests with points for each qualified stay at all of our properties, which are then redeemable for free nights and other goods and services. Members can also use points earned at over 50,000 redemption options, including stays at thousands of hotels, vacation club results and vacation rentals globally as well as gas stations, airlines, charities, and tours or activities. Affiliation with our loyalty programs encourages members to allocate more of their travel spending to our hotels.
Wyndham Rewards has been recognized as one of the simplest, most rewarding loyalty programs in the hotel industry, providing more value to members than any other program. It has won more than 100 awards in recent years, including “Best Hotel Loyalty Program” from US News & World Report, “Best Hotel Loyalty Program” in USA TODAY 10 Best Readers’ Choice Awards and in May 2021, was ranked #1 on WalletHub’s list of “Best Hotel Rewards Programs” for the sixth time in a row.
Wyndham Rewards has over 92 million enrolled members and accounts for over 39% of occupancy at our affiliated hotels globally and 47% in the United States, up from 38% globally and 46% in the United States in 2020. Total membership
had been growing by over 10% annually pre COVID-19 from 2013 to 2019 and grew 6% and 7% in 2020 and 2021, respectively, with approximately 5 million and 6 million new members added in 2020 and 2021, respectively. Our franchisees benefit from the program through repeat stays and members benefit through free night stays, as well as other redemption options for their points, such as gift cards, merchandise and experiences. The program is funded by contributions from eligible revenues generated by Wyndham Rewards members and collected by us from hotels in our system. These funds are applied to reimburse hotels and partners for Wyndham Rewards points redemptions by loyalty members and to pay for administrative expenses and marketing initiatives that support the program.
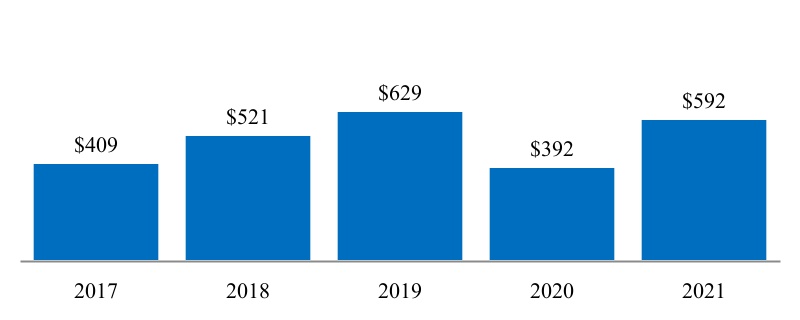
Hotel Franchising Segment Adjusted EBITDA (a) ($ in millions)
______________________
(a)See Part II Item 7. Management’s Discussion and Analysis of Financial Condition and Results of Operations for our definition of adjusted EBITDA and the reconciliation of net income/(loss) to adjusted EBITDA. Adjusted EBITDA has been recasted to conform with the current year presentation. 2020 adjusted EBITDA was impacted by COVID-19.
We license our brands and associated trademarks to nearly 6,000 franchisees globally, which provides for a highly diversified owner base with limited concentration. Our franchisees range from sole proprietors to institutional investors such as public real estate investment trusts. Our franchise agreements are typically 10 to 20 years in length, providing significant visibility into future cash flows. Under these agreements, our direct franchisees generally pay us a royalty fee of 4% to 5% of gross room revenue and a marketing and reservation fee of 3% to 5% of gross room revenue. We occasionally provide financial support in the form of loans or development advances to help generate new business.
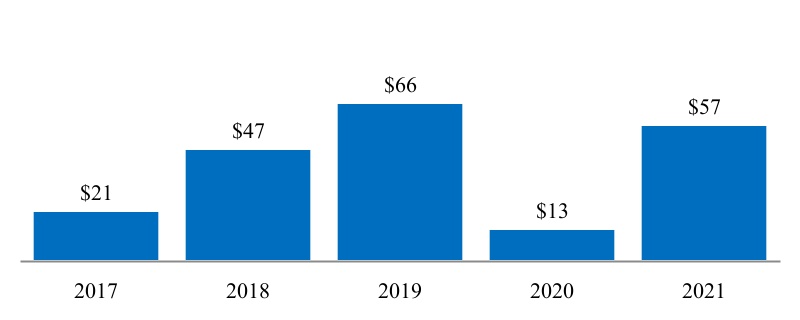
Hotel Management Segment Adjusted EBITDA (a) ($ in millions)
______________________
(a)See Part II Item 7. Management’s Discussion and Analysis of Financial Condition and Results of Operations for our definition of adjusted EBITDA and the reconciliation of net income/(loss) to adjusted EBITDA. 2020 adjusted EBITDA was impacted by COVID-19.
As of December 31, 2021, we had 228 hotels under management contracts and two owned hotels - the Wyndham Grand Rio Mar Beach Resort and Spa in Puerto Rico and the Wyndham Grand Orlando Bonnet Creek. We manage properties under our brands, primarily under the Wyndham, Wyndham Grand, Wyndham Garden, Dolce, La Quinta, Ramada and Dazzler brands in major markets and resort destinations globally. The duration of our management agreements is typically 10 to 20 years. We earn a base management fee, which is based on a percentage of the hotel’s total revenue, and in some cases we earn an incentive fee, which is based on achieving performance metrics agreed upon with hotel owners. Under our management arrangements, we provide all the benefits of a franchising agreement and also conduct the day-to-day-operations of the hotel on behalf of the owner.
On November 8, 2021, CorePoint announced the sale of its business, including 121 La Quinta-branded hotels that CorePoint expects to own at the time of closing, which is targeted to occur in the first quarter of 2022. Wyndham and CorePoint have entered into a definitive agreement concerning the termination of all remaining hotel management contracts with Wyndham, which termination is conditioned upon the closing of their sale transaction. Under the terms of the agreement, CorePoint will pay to Wyndham a termination fee of approximately $84 million upon termination of the hotel management agreements, which represents the recovery of our outstanding hotel management contract balance. Wyndham’s franchise agreements for these hotels are expected to remain in-place at the current fee structure (5% royalties plus 4.5% for marketing and reservation services). This transaction will mark Wyndham’s exit from the lower margin, resource intensive select-service management business and allows for enhanced focus on the highly profitable and cash generative franchising business.
With significant interest from buyers of leisure real estate and our strong preference to concentrate on our asset-light franchised business, during the fourth quarter of 2021, our Board approved a plan to sell its two owned hotels.
As the world’s largest hotel franchising company by number of hotels, with approximately 9,000 hotels under 22 brands across approximately 95 countries, Wyndham Hotels & Resorts is an asset-light business with significant cash generation capabilities. Our company’s mission is to make hotel travel possible for all, and our vision is to be the world’s leading provider of select-service hotel brands by delivering the best value to owners and guests.
In support of our mission and vision, our 2022 strategic priorities are organized around the following primary goals and objectives:
•drive net room growth of 2-4%, including retaining approximately 95% of our current global system and expanding our portfolio to include an economy extended stay brand;
•increase owners’ profitability by optimizing property revenue and maximizing market share through continued investment in our direct channels and reducing on-property labor and operating costs by leveraging our scale and providing our franchisees innovative, contactless technology solutions and services that improve guest experience and increase hotel operating efficiencies; and
•simplify our business model by finalizing the exit from our select-service management business and pursuing the sale of our two owned hotels in order to refocus resources on our highly-profitable and asset-light franchise business.
We are committed to operating our business in a way that is socially, ethically and environmentally responsible. Now more than ever, we must help ensure the future remains bright for travelers around the world. As the world’s largest hotel franchising company by number of hotels, we have a unique opportunity to make a meaningful impact on the world while advancing our mission to make hotel travel possible for all.
As a hospitality company, service and volunteering is deeply rooted in our history and corporate culture. Our teams and franchisees around the world actively engage in their communities, generously giving in ways that enhance the lives of others. We support various charitable programs, including youth and education, military, community and environmental programs. Our philanthropy captures the dedication of our team members, leaders and business partners who have pledged to make lasting, important contributions to the communities in which we operate.
As of December 31, 2021, we had approximately 8,000 employees, consisting of approximately 1,000 employees outside of the United States. Our workforce is comprised of approximately 2,000 corporate employees and approximately 6,000 managed property employees. Approximately 7% of our employees are subject to collective bargaining agreements governing their employment at our managed properties with the Company. Upon the termination of the CorePoint management agreements following the closing of CorePoint’s sale, we expect to have only approximately 3,000 managed property employees.
Culture
At Wyndham, our values underpin our inclusive culture, drive our growth, nurture innovation, and inspire the great experiences we create for team members and the people we serve. Our signature “Count on Me” service culture encourages
each team member to be responsive, respectful, and deliver great experiences to our guests, partners, communities and each other. As a leader in hospitality, we recognize the critical role that service plays for our Company. Our Count on Me promise aligns with our core values – integrity, accountability, inclusiveness, caring and fun – and is embedded and celebrated at all levels of our organization.
Ethical leadership starts with our Board of Directors, and is shared by senior management with every team member across every brand and business at Wyndham Hotels & Resorts. Our Business Principles guide our interactions and set the standard for how every one of us should approach our work in service to our mission. All team members are expected to embrace our shared values and principles, and do their part in maintaining the highest ethical standards and behavior as we continue to grow in communities around the world.
Career Development
Our team members’ career development is key to our ability to attract, reward, and retain the best talent and a top priority at Wyndham. We actively seek to identify and develop talent throughout the organization and maintain a long-standing practice to support the growth and development of all our team members at every stage of their career. We develop and curate a variety of learning content in partnership with external providers to ensure that team members maintain the knowledge, skills, and abilities they need to be successful. These experiences include on-the-job practice, coaching and counseling, effective performance appraisals and honest, timely feedback as well as a vast array of formal leadership programs. Wyndham University, our global learning system, provides our team members with access to a robust learning library that is flexible and accessible to help our team members learn, grow and thrive.
Diversity, Equity and Inclusion
We respect differences in people, ideas and experiences. Our core values, grounded in caring, respect, inclusiveness and fundamental human rights, infuse different perspectives that reflect our diverse customers, team members, and communities around the world. While we continue to be recognized for the progress we have made on our Diversity, Equity and Inclusion journey, we know we can do more. This year, we added a diversity, equity and inclusion goal to performance reviews of all team members; bolstered our efforts to recruit, retain and promote diverse talent; expanded our supplier diversity program; and continued our robust diversity, equity and inclusion training programs – all to inspire our people to contribute to meaningful change in our company, our industry, our communities and the world.
Wyndham has six global affinity business groups and we launched a new regional affinity business group in 2021. These affinity groups serve as fully inclusive networks where empowered team members actively engage to foster innovation, help us grow, and enhance diversity, equity and inclusion globally. Members of our executive committee serve as sponsors of the affinity groups where they serve as allies, mentors and advocates.
Our company was named a best place to work for LGBTQ Equality by earning a perfect score, for the fourth consecutive year, on the Human Rights Campaign’s Corporate Equality Index—a national benchmarking survey on practices related to LGBTQ equality. The Company was also named a 2021 Noteworthy Company for Diversity by Diversity Inc., awarded the VETS Indexes Recognized Employer designation as part of the 2021 VETS Indexes Employer Awards, a 2021 Best for Vets Employer by Military Times, and a 2021 Military Friendly Employer and Military Friendly Supplier Diversity Program by VIQTORY in acknowledgement of our commitment to create sustainable and meaningful benefits for our military community. For the second consecutive year, Wyndham was named one of the Best Places to Work in New Jersey by New Jersey Business Magazine in 2021, we were ranked #4 on Newsweek’s 2021 Most Loved Workplaces list and Forbes recognized Wyndham on its 2022 list of America’s Best Employers.
Throughout our value chain, from team members, franchisees, partners and suppliers to the community and our guests, we believe that diversity of backgrounds, cultures and experiences helps drive our company’s success.
Wellness: Our “Be Well” Program
We are committed to offering programs that focus on the total well-being of all our team members. We also understand that nutrition, exercise, lifestyle management, physical, mental, and emotional wellness, financial health and the quality of the environment in which we work and live are also critical priorities to each of our team members. We believe that health and wellness promote both professional and personal productivity, achievement, and fulfillment, ultimately making us stronger across the organization. To encourage all our team members to lead healthier lifestyles while balancing family, work and other responsibilities, we offer several resources under our Be Well program, including free clinic services, an onsite fitness facility and a Wyndham Relief Fund to help employees who are facing financial hardship.
COVID-19
The health and safety of our team members is of the highest importance. Our focus on the safety of our team members is evident in our ongoing response to the ever-changing COVID-19 protocols and recommendations. We strive to maintain work environments that place the highest degree of care and attention to safety by:
•Continuing to support flexibility to work where you are most comfortable, whether from home, the office or a hybrid of both;
•Increasing cleaning protocols with our Count on Us program;
•Providing regular communications regarding changes and impacts of COVID-19, including health and safety protocols, practices and procedures;
•Extending onsite screening protocols including daily health checks where applicable;
•Providing additional personal protective equipment and cleaning supplies as needed;
•Carrying forward protocols to address actual and suspected COVID-19 cases and potential exposure;
•Maintaining physical distancing procedures for team members who are onsite; and
•Requiring masks to be worn by our team members and guests where applicable.
Human rights are a basic right entitled to all. We remain committed to the well-being and safety of our team members, guests and all those that connect to our industry. In 2021 we continued to donate and activate our team members and 92 million enrolled Wyndham Rewards members to support humanitarian causes around the world.
We partnered with the American Hotel & Lodging Association (“AHLA”) to support the 5-Star Promise, a voluntary commitment to enhance policies, trainings, and resources for hotel employees and guests. We are dedicated to our team members’ safety and security and we are proud to unite with our industry in support of a shared commitment to the incredible people who help make our guests’ travels memorable.
We, along with other leaders in our industry, remain committed to supporting our industry’s efforts to end human trafficking. We have worked to enhance our policies and we have mandated training for all our team members to help them identify and report trafficking activities.
We are proud to work with a number of organizations including ECPAT-USA, an organization whose mission is to protect every child’s human right to grow up free from the threat of sexual exploitation and trafficking.
We also support Polaris, a non-profit organization that spearheads the effort to fight against human trafficking and operates the U.S. National Human Trafficking Hotline, to which Wyndham donates Wyndham Rewards points to provide victims with temporary safe housing. As part of our giving efforts, Wyndham Rewards and its members have donated approximately 123 million points since inception to various non-profit organizations, including organizations supporting humanitarian causes to redeem for travel and other related goods and services.
We are committed to operating sustainably in a way that provides outstanding experiences for those we serve through places to stay that are environmentally responsible. We engage team members, owners and operators around the world to uphold and leverage our core values to think globally and execute locally.
We developed the Wyndham Green Program, which was designed to show how hotels can reduce operating costs through efficiency, help drive revenue from environmentally conscious travelers, remain competitive in the market and increase brand loyalty. The Wyndham Green Program consists of two integral components: 1) the Wyndham Green Certification Program, our internal five-level certification program with five to seven best practices per level that address energy and water conservation, waste diversion, operational efficiency, as well as guest, team member and franchisee education and engagement, and 2) the Wyndham Green Toolbox, a proprietary environmental management tool that tracks, measures and reports environmental performance data to help hotels improve energy efficiency, reduce emissions, conserve water, and reduce waste – thus minimizing environmental impact.
The UN Sustainable Development Goals serve as a strategic guide for our sustainability program, which helps advance our company’s mission of making hotel travel possible for all. Our focus includes:
•Promoting best practices around water conservation at our hotels through our Wyndham Green Program; supporting the access to clean water to all through our community partnerships; and reducing single-use plastics to keep our waterways and oceans pollution-free and safe for wildlife.
•Embarking on a multi-decade journey to reduce our greenhouse gas emissions in alignment with efforts to limit the rise in global temperatures in part by providing our managed hotels with tools and best practices through our Wyndham Green Program that are also available to our franchisees.
•Promoting and expanding best practices for biodiversity protection across our owned and managed properties; partnering with suppliers to make a meaningful impact to protect forests and biodiversity; and sharing best practices around waste diversion through our Wyndham Green Program in order to reduce waste sent to landfills.
We remain committed to reducing our energy, water and carbon footprint across our owned and managed hotels as we work towards achieving our 2025 environmental targets. We continuously evaluate opportunities to increase efficiencies and the usage of renewable energy where feasible as we update our decarbonization plans with longer term targets in alignment with climate science.
We continually monitor and prioritize climate-related risks based on the financial and strategic impacts on our business. Enterprise risks, including those related to sustainability, climate and energy, are identified and assessed on an ongoing basis.
We review climate-related risks using the Task Force for Climate-Related Financial Disclosures (“TFCD”) on an annual basis, which include both transition and physical risks. Some risks that we consider include:
•Current and emerging regulations, like those pertaining to energy efficiency, energy consumption reporting and green building codes and standards at the local, state, and national levels, are considered as risks for our business.
•Acute physical risks (extreme weather events), including hurricanes and wildfires, are increasing in frequency can impact travel demand in specific markets, supply chains and cause physical damage to our assets.
•Chronic physical risks, such as include rising sea levels, rising mean temperatures, changes in precipitation patterns (including droughts) and extreme variability in weather patterns, can influence demand for travel and tourism in key markets adversely by decreasing revenue and/or causing property damage.
Our business model is asset-light, which dramatically limits our capital needs and exposure to the effects of climate change while providing us the ability to mitigate and transfer some of the risks associated with physical risks to third parties. Many factors influence our reputation and the value of our hotel brands including the perception held by our guests, our franchisees, our other key stakeholders and the communities in which we do business. The environmental information that we provide is used to inform their purchasing decisions and can directly impact our revenue associated with both franchisee and management fees.
During the fourth quarter of 2021, Newsweek named Wyndham among the “Most Responsible Companies,” which honors companies with superior environmental and social responsibility practices. As more travelers are looking for environmentally friendly lodging options, it is critical to position our hotels optimally and provide new environmentally responsible options for our guests. Our 2021 ESG Report, which is available on our corporate website and not incorporated by reference into this Annual Report, contains additional information regarding our commitment to social responsibility.
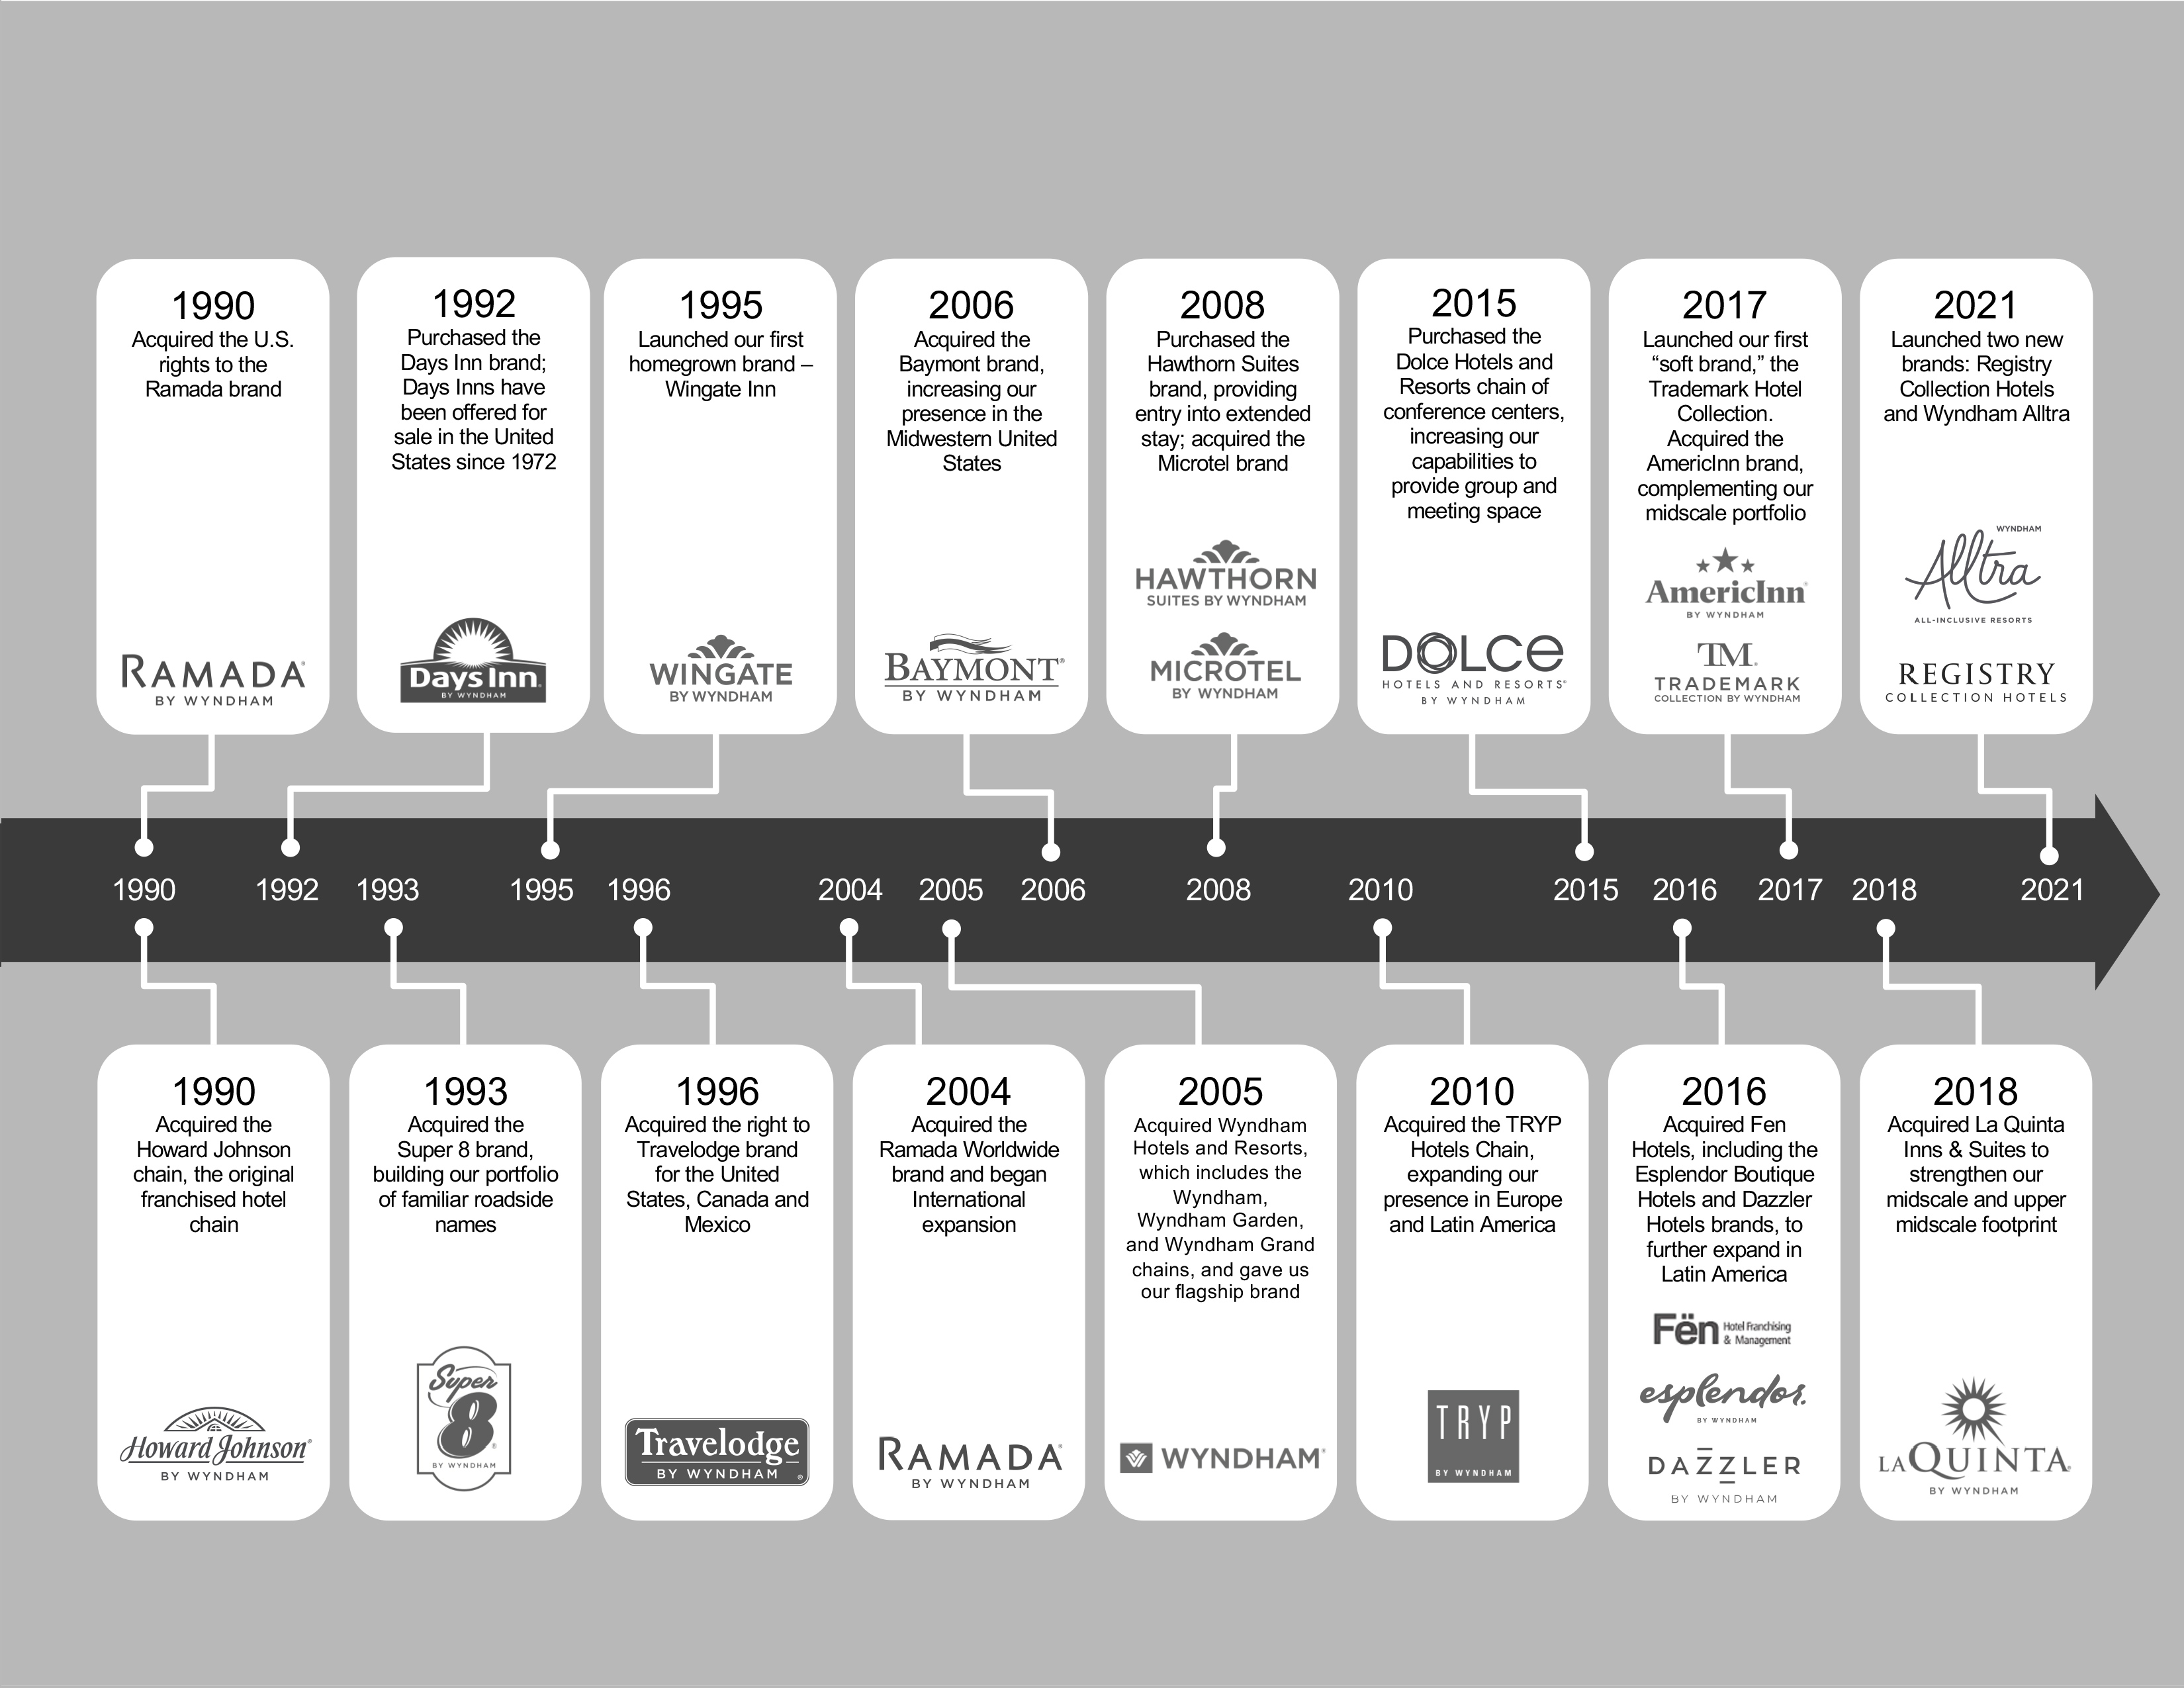
Our business was initially incorporated as Hospitality Franchise Systems, Inc. in 1990 to acquire the Howard Johnson brand and the franchise rights to the Ramada brand in the United States. It was an integral part of Wyndham Worldwide Corporation and its predecessor from 1997 to 2018. Wyndham Hotels became an independent, public company in May 2018 when it was spun-off from Wyndham Worldwide. Our business has grown substantially over time through acquisitions and organic expansion.
We encounter competition among hotel franchisors and lodging operators. We believe franchisees make decisions based principally upon the perceived value and quality of the brand and the services offered. We further believe that the perceived value of a brand name is partially a function of the success of the existing hotels franchised under the brand.
The ability of an individual franchisee to compete may be affected by the location and quality of its property, the number of competitors in the vicinity, community reputation and other factors. A franchisee’s success may also be affected by general, regional and local economic conditions. The potential effect of these conditions on our performance is substantially reduced by virtue of the diverse locations of our affiliated hotels and by the scale of our base. Our system is dispersed among nearly 6,000 franchisees, which reduces our exposure to any one franchisee. One master franchisor in China for the Super 8 brand accounts for 12% of our hotels. CorePoint currently accounts for approximately 2% of our hotels and approximately 60% of our managed hotels. Apart from these relationships, no one franchisee accounts for more than 2% of our hotels.
While the hotel industry is seasonal in nature, periods of higher revenues vary property-by-property and performance is dependent on location and guest base. Based on historical performance, revenues from franchise and management contracts are generally higher in the second and third quarters than in the first or fourth quarters due to increased leisure travel during the spring and summer months. Our cash provided by operating activities tends to be lower in the first half of the year and substantially higher in the second half of the year. However, given the impact of COVID-19 in 2020, our second quarter was the most severely impacted and as such, we had higher revenues and cash flows in the third and fourth quarters. However, during 2021, our revenues and cash provided by operating activities returned to the historic seasonality as our business recovered from the pandemic. The seasonality of our business may cause fluctuations in our quarterly operating results, earnings, profit margins and cash flows. As we expand into new markets and geographical locations, we may experience increased or different seasonality dynamics that create fluctuations in operating results different from the fluctuations we have experienced in the past.
Wyndham Hotels owns the trademarks and other intellectual property rights related to our hotel brands, including the “Wyndham” trademark. We actively use, directly or through our licensees, these trademarks and other intellectual property rights. We operate in a highly competitive industry in which the trademarks and other intellectual property rights related to our hotel brands are very important to the marketing and sales of our services. We believe that our hotel brand names have come to represent high standards of quality, caring, service and value to our franchisees and guests. We register the trademarks that we own in the United States Patent and Trademark Office, as well as with other relevant authorities, where we deem appropriate, and otherwise seek to protect our trademarks and other intellectual property rights from unauthorized use as permitted by law.
Our business is subject to various foreign and U.S. federal and state laws and regulations. In particular, our franchisees are subject to the local laws and regulations in each country in which such hotels are operated, including employment laws and practices, privacy laws and tax laws, which may provide for tax rates that exceed those of the United States and which may provide that our foreign earnings are subject to withholding requirements or other restrictions, unexpected changes in regulatory requirements or monetary policy and other potentially adverse tax consequences. Our franchisees and other aspects of our business are also subject to various foreign and U.S. federal and state laws and regulations, including the Americans with Disabilities Act and similar legislation in certain jurisdictions outside of the United States.
The Federal Trade Commission, various states and other foreign jurisdictions regulate the offer and sale of franchises. The Federal Trade Commission requires us to furnish to prospective franchisees a franchise disclosure document containing prescribed information prior to execution of a binding franchise agreement or payment of money by the prospective franchisee. State regulations also require franchisors to make extensive disclosure to prospective franchisees, and a number of states also require registration of the franchise disclosure document prior to sale of any franchise within the state. Non-compliance with disclosure and registration laws can affect the timing of our ability to sell franchises in these jurisdictions. Additionally, laws in many states and foreign jurisdictions also govern the franchise relationship, such as imposing limits on a franchisor’s ability to terminate franchise agreements or to withhold consent to the renewal or transfer of these agreements. Failure to comply with these laws and regulations has the potential to result in fines, injunctive relief, and/or payment of damages or restitution to individual franchisees or regulatory bodies, or negative publicity impairing our ability to sell franchises.
| | |
| INFORMATION ABOUT OUR EXECUTIVE OFFICERS |
Geoffrey A. Ballotti, 60, serves as our President and Chief Executive Officer and member of our Board of Directors. From March 2014 to March 2018, Mr. Ballotti served as President and Chief Executive Officer of Wyndham Hotel Group. From March 2008 to March 2014, Mr. Ballotti served as Chief Executive Officer of Wyndham Destination Network. From October 2003 to March 2008, Mr. Ballotti was President of the North America Division of Starwood Hotels and Resorts Worldwide. From 1989 to 2003, Mr. Ballotti held leadership positions of increasing responsibility at Starwood Hotels and Resorts Worldwide, including President of Starwood North America, Executive Vice President, Operations, Senior Vice President, Southern Europe and Managing Director, Ciga Spa, Italy. Prior to joining Starwood Hotels and Resorts Worldwide, Mr. Ballotti was a Banking Officer in the Commercial Real Estate Group at the Bank of New England.
Michele Allen, 47, serves as our Chief Financial Officer. From May 2018 to December 2019, Ms. Allen served as Executive Vice President and Treasurer. From April 2015 to May 2018, Ms. Allen served as Senior Vice President of Finance
for Wyndham Worldwide. From August 2006 to March 2015, Ms. Allen held leadership positions of increasing responsibility at Wyndham Hotel Group, including Senior Vice President of Finance and Controller. From 1999 to August 2006, Ms. Allen served in positions of increasing responsibility at Wyndham’s predecessor. Ms. Allen began her career as an independent auditor at Deloitte & Touche LLP.
Paul F. Cash, 52, serves as our General Counsel, Chief Compliance Officer and Corporate Secretary. From October 2017 to May 2018, Mr. Cash served as Executive Vice President and General Counsel of Wyndham Hotel Group. From April 2005 to September 2017, Mr. Cash served as Executive Vice President and General Counsel and in legal executive positions with increasing leadership responsibility for Wyndham Destination Network. From January 2003 to April 2005, Mr. Cash was a partner in the Mergers and Acquisitions, International and Entertainment and New Media practice groups of Alston & Bird LLP and from February 1997 to December 2002 he was an associate at Alston & Bird LLP. From August 1995 until February 1997, Mr. Cash was an associate at the law firm Pünder, Volhard, Weber & Axster in Frankfurt, Germany.
Lisa Borromeo Checchio, 41, serves as our Chief Marketing Officer. From May 2018 to January 2019, Ms. Checchio served as our Senior Vice President and Chief Marketing Officer. From August 2015 to May 2018, Ms. Checchio served in positions of increasing responsibility for Wyndham Hotel Group including Senior Vice President, Global Brands. From July 2004 to August 2015, Ms. Checchio held several marketing positions of increasing responsibility and served as Brand Marketing and Advertising Director for JetBlue Airways.
Scott LePage, 55 serves as our President, the Americas. From November 2019 to May 2020, Mr. LePage served as Executive Vice President, Managed Operations for Wyndham Hotel Group. Mr. LePage joined Wyndham Worldwide in October 2010 as Vice President, Internal Audit. He moved into Operations in 2013 and has served in a number of roles in Operations for North America leading up to his selection as President, the Americas. Mr. LePage previously spent 10 years as a Naval Aviation Officer in the U.S. Navy leading operational teams. Mr. LePage was also a Manager at Arthur Anderson and a Director of Financial Planning and Analysis at InterActive Corporation.
Monica Melancon, 54, serves as our Chief Human Resource Officer. From March 2020 to February 2021, Ms. Melancon served as Group Vice President, Human Resources – Managed. Ms. Melancon joined Wyndham Hotels & Resorts, Inc. in May 2018 and continued in her role as Vice President, Employee Relations following the Company’s acquisition of La Quinta in May 2018 where she had served in the same role from August 2016 to May 2018. Ms. Melancon previously served as Regional Employee Relations Manager of La Quinta from March 2015 to July 2016 Prior to joining La Quinta, Ms. Melancon served 15 years in various human resource positions of increasing responsibility at Target Corporation.
Nicola Rossi, 55, serves as our Chief Accounting Officer. From July 2006 to May 2018, Mr. Rossi served as Senior Vice President and Chief Accounting Officer for Wyndham Worldwide. Mr. Rossi was Vice President and Controller of Cendant’s Hotel Group from June 2004 to July 2006. From April 2002 to June 2004, Mr. Rossi served as Vice President, Corporate Finance for Cendant. From April 2000 to April 2002, Mr. Rossi was Corporate Controller and from June 1999 to March 2000 was Assistant Corporate Controller of Jacuzzi Brands, Inc. Mr. Rossi began his career as an independent auditor at Deloitte & Touche LLP.
Scott R. Strickland, 51, serves as our Chief Information Officer. From March 2017 to May 2018, Mr. Strickland served as Chief Information Officer of Wyndham Hotel Group. From November 2011 to March 2017, Mr. Strickland served as Chief Information Officer for Denon Marantz Electronics. From February 2005 to June 2010, Mr. Strickland served as Chief Information Officer for Black & Decker HHI. From 1999 to 2005, Mr. Strickland served as an Associate Partner with PricewaterhouseCoopers.
Item 1A. Risk Factors.
You should carefully consider each of the following risk factors and all of the other information set forth in this report. Based on the information currently known to us, we believe that the following information identifies the most significant risk factors affecting our Company. However, the risks and uncertainties we face are not limited to those set forth in the risk factors described below. Additional risks and uncertainties not presently known to us or that we currently believe to be immaterial may also adversely affect our business. In addition, past financial performance may not be a reliable indicator of future performance and historical trends should not be used to anticipate results or trends in future periods.
If any of the following risks and uncertainties develop into actual events, these events could have a material adverse effect on our business, financial condition or results of operations. In such case, the trading price of our common stock could decline.
Risks Relating to COVID-19 and Our Industry
The effects of the outbreak of COVID-19 have disrupted the operations of our franchisees, property owners and us, which have had, and could have in the future, a negative adverse effect on our business, financial condition, results of operations outlook, plans, growth and stock price.
Since first being identified in December 2019, COVID-19 has continued to have an unprecedented impact on the global economy and the hospitality industry due to the implementation of a wide variety of control measures including but not limited to states of emergency and restrictions on travel and large gatherings. These measures resulted in cancelled and reduced travel and complete and partial suspensions of hotel operations and hotel closures. We also experienced disruptions to the operations of our franchisees, property owners and us, all of which has had, and could have in the future, a negative adverse effect on our business, financial condition, including cash flow and liquidity, results of operations, outlook, plans, growth and stock price.
The effects of COVID-19 continue to evolve and, accordingly, there remains significant uncertainties and risks around the duration and severity of the pandemic, the continuing business disruptions resulting from COVID-19, the pandemic’s impact on the global economy, consumer confidence, various businesses, and, consequently, our business, operations and financial condition. These risks include:
•Revenues and Expenses: Due to the spread of COVID-19, during 2020 we experienced significant decreases in demand and RevPAR and negative impacts to our revenues, profitability and the amount of management and franchise fee revenues we were able to generate from our franchised and managed properties. Although our results have improved due to the ongoing recovery in travel demand, we may face impacts in the future as a result of any additional resurgence in the number of COVID-19 cases or increased rates of infectiousness or severity related to mutations or variants of COVID-19 and the timing, availability and adoption rates of vaccinations, booster shots and other treatments for COVID-19.
•Operations: Due to the significant decrease in travel demand during 2020, we took actions to manage our operating expenses and conserve our financial resources. Although our results have improved due to the ongoing recovery of travel demand in 2021, given the uncertainty relating to COVID-19, we may have to take additional actions in the future, which cannot be predicted.
•Financial Condition and Indebtedness: An event of default under our credit agreement would enable our lenders to terminate their commitments and would trigger consequences under other indebtedness or financial instruments. If our business is negatively impacted by COVID-19 in the future, we may not be able to make required payments, satisfy covenants or successfully amend the documents governing our indebtedness. Any such failure could result in a default and acceleration of the underlying debt and under other indebtedness that contains cross-default provisions.
•Growth: Our plans for growth were, and may in the future be, negatively impacted by COVID-19. In the future, our franchisees and property owners could have difficulty obtaining financing on reasonable terms or at all due to COVID-19. In addition, our development pipeline is subject to a number of risks that are and could continue to be exacerbated by COVID-19, including developers experiencing construction delays as a result of restrictions on business activity and supply chain interruptions which could cause delays in the completion and development of new hotels, which could impact our net rooms growth and/or slowing the rate of our pipeline growth.
•Capital Markets Impact: The global stock markets have experienced, and may continue to experience, volatility as a result of COVID-19. During 2020, the price of our common stock was volatile and experienced periods of significant declines, which may happen again in the future as a result of COVID-19. The significant uncertainty created by the impact of COVID-19 has caused the global economy, business confidence and consumer confidence to have, and likely continue to have, a significant effect on the market price of securities generally, including on our common stock.
See “Item 2. Management’s Discussion and Analysis of Financial Condition and Results of Operations” for a description of the mitigating actions we have taken and our liquidity and indebtedness.
Despite the steps we have taken to assess and mitigate the impact of COVID-19, the future impacts of COVID-19 on our business operations, financial results, outlook, plans, growth, cash flows and liquidity, as well as its impact on our franchisees and property owners and their operations, our guests and our team members, the hospitality industry and overall demand for travel will depend on future developments, which are highly uncertain and cannot be predicted, including, among other things:
•the scope and duration of the pandemic, including any additional resurgence in the number of COVID-19 cases or increased rates of infectiousness or severity related to mutations or variants of COVID-19 and the timing, availability and adoption rates of vaccinations, booster shots and other treatments for COVID-19;
•new actions governments, businesses and individuals may take in response to any resurgence, including stay-in-place directives (including, for instance, quarantine, isolation guidelines and mandates) and other safety mitigation guidance;
•the continued or enhanced need for, and success of, mitigation efforts, containment measures and other responses by our franchisees, property owners, and us;
•the potential of our franchisees and property owners to declare bankruptcy or cause their lenders to declare a default, accelerate debt or foreclose on the property, which could result in the termination of our franchise or management agreements;
•actual or perceived risks of contracting COVID-19, including any variants, and new information which may emerge concerning severity and impact;
•the negative impact of COVID-19 on global and regional economies and economic activity generally, including the duration and magnitude of its impact on unemployment rates, employee attrition, the tightening and increasingly competitive labor market and consumer confidence, discretionary spending and pricing;
•our relationships with franchisees and property owners;
•our liquidity based on our access to capital and financing as a result of COVID-19 and the terms and cost thereof, as well as our credit rating;
•potential risk of additional impairments to certain intangible assets, such as our trademarks and our franchised and managed goodwill;
•risk posed by the operational challenges of remote work arrangements and return to work arrangements, including potential challenges to the maintenance of our financial reporting processes and related controls;
•cybersecurity risks and risks related to unauthorized access to confidential information due to our increased reliance on remote access to information systems;
•potential exposure to make payments to third-parties to whom we made financial guarantees;
•the impact on our contracts with our partners, including force majeure provisions;
•labor activities or additional demands or requests from labor unions or labor disputes or disruptions or the impact from position eliminations, furloughs or other actions;
•unexpected additional costs and expenses incurred by us, franchisees and property owners related to the effects of COVID-19 and steps taken to counteract future outbreaks, including enhanced health and hygiene or social distancing requirements;
•the effects of any steps we take to reduce operating costs as a result of COVID-19, including with respect to our brand reputation, our ability to operate the company, our ability to attract and retain team members and guest experience and loyalty;
•the potential exposure related to guests or team members who may contract COVID-19; and
•the potential diversion of management’s attention from the business due to COVID-19, including if any key team member becomes ill from COVID-19 or unable to work.
The potential effects of COVID-19 cannot be predicted in terms of type, duration or impact and could intensify or otherwise affect many of the other risks set forth in this Item 1A of this Annual Report or present other unforeseen consequences for the business.
The lodging industry is highly competitive, and we are subject to risks related to competition that may adversely affect our performance and growth.
Our continued success depends upon our ability to compete effectively in markets that contain numerous competitors, some of whom may have significantly greater financial, marketing and other resources than we have. We compete with other hotel franchisors for franchisees and we may not be able to grow our franchise system. New hotels may be constructed and these additions to supply create new competitors, in some cases without corresponding increases in demand for lodging. Competition may reduce fee structures, potentially causing us to lower our fees, and may require us to offer terms to prospective franchisees less favorable to us than current franchise agreements, which may adversely impact our profits. Our franchisees also compete with alternative lodging channels, including third-party providers of short-term rental properties and serviced apartments. Increasing use of these alternative lodging channels could adversely affect the occupancy and/or average rates at franchised hotels and our revenues. The use of business models by competitors that are different from ours may require us to change our model so that we can remain competitive.
Declines in or disruptions to the travel and hotel industries may adversely affect us.
We face risks affecting the travel and hotel industries that include: economic slowdown and recession; economic factors such as increased costs of living and reduced discretionary income adversely impacting decisions by consumers and businesses to use travel accommodations; domestic unrest, terrorist incidents and threats and associated heightened travel security measures; political instability or political and regional strife; acts of God such as earthquakes, hurricanes, fires, floods, volcanoes and other natural disasters; war; concerns with or threats of contagious diseases or health epidemics or pandemics, such as COVID-19; environmental disasters; lengthy power outages; cyber threats, increased pricing, financial instability and capacity constraints of air carriers; airline job actions and strikes; and increases in gasoline and other fuel prices. Increases in the frequency and severity of extreme weather events and other consequences of climate change (including any related regulation) could impact travel demand generally, lead to supply chain interruptions, cause damage to physical assets or adversely impact the accessibility or desirability of travel to certain locations. For example, certain of our franchisees’ and owners’ properties and the two resorts we own are located in coastal areas that could be threatened should sea levels dramatically rise. As a result we may experience decreased revenue and/or property damage that could impact the revenue and cash flow generated from these assets. Any such decline in or disruptions to the travel or hotel industries may adversely affect our franchised hotels, the operations of current and potential franchisees, developers and hotel owners with which we have hotel management contracts.
Third-party Internet travel intermediaries and peer-to-peer online networks may adversely affect us.
Consumers use third-party Internet travel intermediaries, including search engines, and peer-to-peer online networks to search for and book their lodging accommodations. As the percentage of internet reservations increases, travel intermediaries may be able to obtain higher commissions and reduced room rates to the detriment of our business. Additionally, such travel intermediaries may divert reservations away from our direct online channels or increase the overall cost of Internet reservations for our affiliated hotels through their fees and a variety of online marketing methods, including the purchase by certain travel intermediaries of keywords consisting of or containing our hotel brands from Internet search engines to influence search results and direct guests to their websites. If we fail to reach satisfactory agreements with intermediaries, our affiliated hotels may not appear on their websites and we could lose business as a result. Further, travel intermediaries may seek to offer distribution services under their own brands directly to lodging accommodations in competition with our core franchise business.
Risks Relating to Our Operations and Acquisitions
We are subject to business, financial, operating and other risks common to the hotel, hotel franchising and hotel management industries which also affect our franchisees and hotel owners, any of which could reduce our revenues, limit our growth or otherwise impact our business.
A significant portion of our revenue is derived from fees based on room revenues at hotels franchised under our brands. As such, our business is subject, directly or through our franchisees, to risks common in the hotel, hotel franchising and hotel management industries, including risks related to:
•our ability to meet our objectives for growth in the number of our franchised hotels, hotel rooms in our franchise system and hotels under management and to retain and renew franchisee and hotel management contracts, all on favorable terms;
•the number, occupancy and room rates of hotels operating under our franchise and management agreements;
•the delay of hotel openings in our pipeline;
•changes in the supply and demand for hotel rooms;
•increased pricing or supply chain disruptions for raw materials which could cause delays in the completion and development of new hotels;
•our ability to develop and maintain positive relations and contractual arrangements with current and potential franchisees and hotel owners under our hotel management agreements and other third parties, including marketing alliances and affiliations with e-commerce channels;
•our franchisees’ pricing decisions;
•the quality of the services provided by franchisees and their investments in the maintenance and improvement of properties;
•the bankruptcy or insolvency of a significant number of our franchised or managed hotels;
•the financial condition of franchisees, owners or other developers and the availability of financing to them;
•adverse events occurring at franchised or managed hotel locations, including personal injuries, food tampering, contamination or the spread of illness, including COVID-19;
•negative publicity, which could damage our hotel brands;
•our ability to successfully market our current or any future hotel brands and programs, including our rewards program, and to service or pilot new initiatives;
•our relationship with Highgate Holdings, Inc. and certain of its affiliates or subsidiaries (collectively referred to herein as “Highgate”);
•changes in the laws, regulations and legislation affecting our business, internationally and domestically;
•our failure to adequately protect and maintain our trademarks and other intellectual property rights;
•the relative mix of branded hotels in the various hotel industry price categories;
•corporate budgets and spending and cancellations, deferrals or renegotiations of group business;
•seasonal or cyclical volatility in our business;
•operating costs, including as a result of inflation, energy costs and labor costs, such as minimum wage increases and unionization, workers’ compensation and health-care related costs and insurance; and
•disputes, claims and litigation and other legal proceedings concerning our or our franchised or managed hotels’ operations, including with consumers, government regulators, other businesses, franchisees and hotel owners, organized labor activities and class actions.
Any of these factors could reduce our revenues, increase our costs or otherwise limit our opportunities for growth.
Our international operations are subject to additional risks not generally applicable to our domestic operations.
Our international operations are subject to numerous risks including: exposure to local economic conditions; potential adverse changes in the diplomatic relations of foreign countries with the United States; hostility from local populations; political instability, including as a result of the United Kingdom’s exit from the European Union and the uncertainty related to the implementation and application of the related agreements between the United Kingdom and the European Union, trade disputes with trade partners, including China and other geopolitical risks; threats or acts of terrorism; the effect of disruptions caused by severe weather, natural disasters, outbreak of disease, such as COVID-19 or other events that make travel to a particular region less attractive or more difficult; the presence and acceptance of varying levels of business corruption in international markets; restrictions and taxes on the withdrawal of foreign investment and earnings; government policies against businesses or properties owned by foreigners; investment restrictions or requirements; diminished ability to legally enforce our contractual rights in foreign countries; forced nationalization of hotel properties by local, state or national governments; foreign exchange restrictions; fluctuations in foreign currency exchange rates; the ability to comply with or the effect of complying with new and developing laws, regulations and policies of foreign governments, including with respect to climate change; conflicts between local laws and U.S. laws, including laws that impact our rights to protect our intellectual property; withholding and other taxes on remittances and other payments by subsidiaries; and changes in and application of foreign taxation structures including value added taxes. Any adverse outcome resulting from the financial instability or performance of foreign economies, the instability of other currencies and the related volatility on foreign exchange and interest rates could adversely impact our results of operations, financial position or cash flows.
We are dependent on our senior management and the loss of any member of our senior management could harm our business.
We believe that our future growth depends in part on the continued services of our senior management team. Losing the services of any member of our senior management team, including due to the increased availability of permanent remote positions, could adversely affect our strategic relationships and impede our ability to execute our business strategies. The market for qualified individuals may be highly competitive and finding and recruiting suitable replacements for senior management may be difficult, time-consuming and costly. While we have updated our policies and practices to provide more flexibility for remote work, we may experience increased attrition of employees to other opportunities as a result of the tightening and increasingly competitive labor market and, particularly as we have reopened our offices, as certain employees may seek more flexible work alternatives than we offer, may seek positions with companies outside of the geographic area in which they live that offer remote work opportunities, or may decide to scale back their work life for personal reasons. If we are unable to retain our personnel, particularly our executive officers and senior management team, our business could be harmed.
Acquisitions and other strategic transactions may not prove successful and could result in operating difficulties and failure to realize anticipated benefits.
We regularly consider a wide array of acquisitions and other potential strategic transactions, including acquisitions of hotel brands, businesses and real property, joint ventures, business combinations, strategic investments and dispositions. Any of these transactions could be material to our business. We often compete for these opportunities with third parties, which may cause us to lose potential opportunities or to pay more than we may otherwise have paid absent such competition. We
may not be able to identify and consummate strategic transactions and opportunities on favorable terms and any such strategic transactions or opportunities, if consummated, may not be successful.
Risks Relating to Our Relationships with Third Parties
Our revenues could be impacted if we are unable to maintain our franchise agreements with Highgate.
In connection with the La Quinta acquisition, we entered into hotel-management agreements and hotel franchise agreements with CorePoint Lodging, Inc. (“CorePoint”). We are also subject to certain agreements related to CorePoint’s previously completed spin-off of its real estate business. In November 2021, we agreed to terminate all remaining hotel-management agreements with CorePoint at the closing of its sale to Highgate, which is expected to occur in the first quarter of 2022. We will receive a termination fee of approximately $84 million at that time. However, our franchise agreements with CorePoint with respect to the remaining CorePoint hotels will remain in place and be assumed by a subsidiary of Highgate on the current terms. If these franchise agreements are prematurely terminated due to one party’s uncured default of their obligations or the parties’ mutual agreement or these agreements are not renewed following their expiration, our profitability and revenues could decrease and our growth potential may be adversely affected.
Our license and other fees could be impacted by any softness in Travel + Leisure’s sales of vacation ownership interests.
In connection with the spin-off, we entered into a number of agreements with Travel + Leisure that govern our ongoing relationship with Travel + Leisure. Our success depends, in part, on the maintenance of our ongoing relationship with Travel + Leisure, Travel + Leisure’s performance of its obligations under these agreements and continued strategic focus on sales of vacation ownership interests, including Travel + Leisure’s maintenance of the quality of products and services it sells under the “Wyndham” trademark and certain other trademarks and intellectual property that we license to Travel + Leisure. Under the license, development and noncompetition agreement, Travel + Leisure pays us significant royalties and other fees based on the volume of Travel + Leisure’s sales of vacation ownership interests and other vacation products and services. If Travel + Leisure is unable to compete effectively for sales of vacation ownership interests or COVID-19 continues to negatively impact such sales, our royalty fees under such agreement could be adversely impacted. If we are unable to maintain a good relationship with Travel + Leisure, or if Travel + Leisure does not perform its obligations under these agreements, fails to maintain the quality of the products and services it sells under the “Wyndham” trademark and certain other trademarks or fails to pay such royalties, our earnings could decrease.
Risks Relating to Regulation and Technology
Our operations are subject to extensive regulation and the cost of compliance or failure to comply with regulations may adversely affect us.
Our operations are regulated by federal, state and local governments in the countries in which we operate. In addition, U.S. and international federal, state and local regulators may enact new laws and regulations that may reduce our profits or require us to modify our business practices substantially. If we are not in compliance with applicable laws and regulations, including, among others, those governing franchising, hotel operations, lending, information security, data protection and privacy (such as the General Data Protection Regulation, the California Consumer Privacy Act, the recently enacted Personal Information Protection Law of the People’s Republic of China or similar laws or regulations), credit card security standards, marketing, including sales, consumer protection and advertising, unfair and deceptive trade practices, fraud, bribery and corruption, licensing, labor, employment, anti-discrimination, health care, health and safety, accessibility, immigration, gaming, environmental, intellectual property, securities, stock exchange listing, accounting, tax and regulations applicable under the Dodd-Frank Act, the Office of Foreign Assets Control, the Americans with Disabilities Act, the Sherman Act, the Foreign Corrupt Practices Act and local equivalents in international jurisdictions, including the United Kingdom Bribery Act, we may be subject to regulatory investigations or actions, fines, civil and/or criminal penalties, injunctions and potential criminal prosecution. Changes to such laws and regulations and the cost of compliance or failure to comply with such regulations may adversely affect us.
Additionally, some jurisdictions are considering or have undertaken actions to regulate greenhouse gas emissions, energy efficiency, energy consumption reporting and green building codes. Such actions could affect the operation of our and our franchisees’ properties and result in increased capital expenditures, such as those used to improve the energy efficiency of properties. The cost of such governmental actions would depend upon the specific requirements and may impact our financial condition, results of operations, or ability to compete.
Failure to maintain the security of personally identifiable and proprietary information, non-compliance with our contractual obligations regarding such information or a violation of our privacy and security policies with respect to such information could adversely affect us.
In connection with our business, we and our service providers collect, use and store large volumes of certain types of personal and proprietary information pertaining to guests, franchisees, stockholders and employees. Such information includes, but is not limited to, large volumes of guest credit and payment card information. We are at risk of attack by cybercriminals operating on a global basis attempting to gain access to such information. In connection with data security incidents involving a group of Wyndham brand hotels that occurred between 2008 and 2010, one of our subsidiaries is subject to a stipulated order with the U.S. Federal Trade Commission (the “FTC”), pursuant to which, among other things, it must meet certain requirements for reasonable data security as outlined in the stipulated order.
While we maintain what we believe are reasonable security controls over personal and proprietary information, a breach of or breakdown in our systems that results in the unauthorized release of personal or proprietary information could nevertheless occur and has a material adverse effect on our hotel brands, reputation, business, financial condition and results of operations, as well as subject us to significant fines, litigation, losses, third-party damages and other liabilities, or our subsidiary could fail to comply with the stipulated order with the FTC. We may face increased cybersecurity risks due to our increasing reliance on internet technology and the number of our employees who are working remotely, which may create additional opportunities for cybercriminals to exploit vulnerabilities. Cybercriminal “hacker” activity has increased in sophistication, duration, and frequency since the start of the pandemic and poses additional risks.
Additionally, the legal and regulatory environment surrounding information security and privacy in the U.S. and international jurisdictions is constantly evolving including recent developments and uncertainties with regards to requirements for the cross-border transfer of personal information due to emerging laws, regulations and judicial decisions (such as the European Court of Justice’s decision invalidating Privacy Shield as a transfer mechanism). Other jurisdictions may impose additional restrictions or requirements on cross-border transfers including limitations on transferring data beyond the originating country. Violation or non-compliance with any of these laws or regulations, contractual requirements relating to data security and privacy, or with our own privacy and security policies, either intentionally or unintentionally, or through the acts of intermediaries could have a material adverse effect on our hotel brands, reputation, business, financial condition and results of operations, as well as subject us to significant fines, litigation, losses, third-party damages and other liabilities. While we maintain cyber risk insurance, in the event of a significant security or data breach, this insurance may not cover all of the losses that we may suffer.
We rely on information technologies and systems to operate our business, which involves reliance on third-party service providers and on uninterrupted operation of service facilities.
We rely on information technologies and systems to operate our business, which involves reliance on third-party service providers (including cloud-based service providers) such as Sabre Corporation and its SynXis Platform and uninterrupted operations of our and third party service facilities, including those used for reservation systems, hotel/property management, communications, procurement, call centers, operation of our loyalty program and administrative systems. We and our vendors also maintain physical facilities to support these systems and related services. As a result, in addition to failures that occur from time to time in the ordinary course, we and our vendors may be vulnerable to system failures, computer hacking, cyber-terrorism, computer viruses and other intentional or unintentional interference, negligence, fraud, misuse and other unauthorized attempts to access or interfere with these systems and our personal and proprietary information. The increased scope and complexity of our information technology infrastructure and systems could contribute to the potential risk of security breaches or breakdown. Any natural disaster, disruption or other impairment in our technology capabilities and service facilities or those of our vendors could adversely affect our business. In addition, failure to keep pace with developments in technology could impair our operations or competitive position.
Risks Relating to Our Indebtedness and Tax Treatment
Changes in U.S. federal, state and local or foreign tax law, interpretations of existing tax law or adverse determinations by tax authorities could increase our tax burden or otherwise adversely affect our financial condition or results of operations.
We are subject to taxation at the federal, state and local levels in the United States and various other countries and jurisdictions. Our future effective tax rate and cash flows could be affected by changes in the composition of earnings in jurisdictions with differing tax rates, changes in statutory rates and other legislative changes, changes in the valuation of our deferred tax assets and liabilities, changes in determinations regarding the jurisdictions in which we are subject to tax, and our ability to repatriate earnings from foreign jurisdictions. From time to time, U.S. federal, state and local and foreign governments make substantive changes to tax rules and their application, which could result in materially higher corporate
taxes than would be incurred under existing tax law and could adversely affect our financial condition or results of operations. We are subject to ongoing and periodic tax audits and disputes in U.S. federal and various state, local and foreign jurisdictions. An unfavorable outcome from any tax audit could result in higher tax costs, penalties and interest, thereby adversely affecting our financial condition or results of operations.
In addition, we are directly and indirectly affected by new tax legislation and regulation and the interpretation of tax laws and regulations worldwide. Changes in such legislation, regulation or interpretation could increase our taxes and have an adverse effect on our operating results and financial condition. This includes potential changes in tax laws or the interpretation of tax laws arising out of the Base Erosion Profit Shifting project initiated by the Organization for Economic Co-operation and Development (“OECD”). In July and October of 2021, the OECD/G-20 Inclusive Framework on BEPS released statements outlining a political agreement on the general rules to be adopted for taxing the digital economy, specifically with respect to nexus and profit allocation (Pillar One) and rules for a global minimum tax (Pillar Two). Further details regarding implementation of these rules are expected to be finalized in the near future. These rules, should they be implemented via domestic legislation of countries or via international treaties, could have a material impact on our effective tax rate or result in higher cash tax liabilities. There can be no assurance that our tax payments, tax credits, or incentives will not be adversely affected by these or other initiatives.
We are subject to risks related to our debt, hedging transactions, our extension of credit and the cost and availability of capital.
As of December 31, 2021, we had aggregate outstanding debt of $2,084 million. We may incur additional indebtedness in the future, which may magnify the potential impacts of the risks related to our debt. Our debt instruments contain restrictions, covenants and events of default that, among other things, could limit our ability to respond to changing business and economic conditions; take advantage of business opportunities; incur or guarantee additional debt; pay dividends or make distributions or repurchases; make investments or acquisitions; sell, transfer or otherwise dispose of certain assets; create liens; consolidate or merge; enter into transactions with affiliates; and prepay and repurchase or redeem certain indebtedness. Failure to meet our payment obligations or comply with other financial covenants could result in a default and acceleration of the underlying debt and under other debt instruments that contain cross-default provisions.
In order to reduce or hedge our financial exposure to the effects of currency and interest rate fluctuations, we may use financial instruments, such as hedging transactions. Changes in interest rates may adversely affect our financing costs and/or change the market value of our hedging transactions. Any failure or non-performance of counterparties under our hedging transactions could result in losses.
The London Interbank Offered Rate (“LIBOR”) is expected to no longer be available after June 30, 2023 for the primary U.S. dollar LIBOR settings used by the Company. Our credit facility gives us the option to use LIBOR as a funding benchmark and our interest rate swaps are based on the one-month U.S. dollar LIBOR, but also allows us and the administrative agent to replace LIBOR with an alternative benchmark rate, subject to the right of the majority of the lenders to object thereto, as set forth in the credit facility. The International Swaps and Derivatives Association has issued terms that can be applied to determine the alternative reference rates under swap transactions and the timing of the switch to such alternatives.
There have been significant efforts by market participants and government and regulatory bodies in the United States and abroad to identify suitable replacement rates and develop processes for migration to the use of the alternatives. In the United States, the Alternative Reference Rates Committee (“AARC”), a committee of private sector entities convened by the Federal Reserve Board and the Federal Reserve Bank of New York, has recommended the Secured Overnight Financing Rate (“SOFR”) plus a recommended spread adjustment as LIBOR’s replacement. There are significant differences between LIBOR and SOFR, such as LIBOR being an unsecured lending rate while SOFR is a secured lending rate, and SOFR is an overnight rate while LIBOR reflects term rates at different maturities. If our LIBOR-based borrowings are converted to SOFR, the differences between LIBOR and SOFR, plus the recommended spread adjustment, could result in interest costs that are higher than if LIBOR remained available, which could have a material adverse effect on our operating results. Although SOFR is the ARRC’s recommended replacement rate, it is also possible that lenders may instead choose alternative replacement rates that may differ from LIBOR in ways similar to SOFR or in other ways that would result in higher interest costs for us. It is not yet possible to predict the magnitude of LIBOR’s discontinuation on our borrowing costs given the remaining uncertainty about which rates will replace LIBOR.
In addition, we extend credit to assist franchisees and hotel owners in converting to, or building a new hotel under, one of our hotel brands through development advance notes and mezzanine or other forms of subordinated financing. The inability of franchisees and hotel owners to pay back such loans, including as a result of the ongoing effects of COVID-19, could materially and adversely affect our cash flows and business.
We may need to dedicate a significant portion of our cash flows to the payment of principal and interest. Our ability to obtain additional financing for working capital, capital expenditures, acquisitions, debt service requirements, or general corporate or other purposes may be limited, and we may be unable to renew or refinance our debt on terms as favorable as our existing debt or at all. Additionally, certain market liquidity factors, including uncertainty or volatility in the equity and credit markets, outside of our control could affect our access to credit and capital in the future and adversely impact our business plans and operating model. Our credit rating and the market value of our common stock could also be affected. While we believe we have adequate sources of liquidity to meet our anticipated requirements for working capital, debt service and capital expenditures for the foreseeable future, if we are unable to refinance or repay our outstanding debt when due, our results of operations and financial condition will be materially and adversely affected.
Changes to estimates or projections used to assess the fair value of our assets or operating results that are lower than our current estimates may cause us to incur additional impairment losses and require us to write-off all or a portion of the remaining value of our goodwill or other intangibles of companies we have acquired.
Our total assets include goodwill and other intangible assets. We evaluate our goodwill for impairment on an annual basis or at other times during the year if events or circumstances indicate that it is more likely than not that the fair value is below the carrying value. We may be required to record additional significant non-cash impairment charges in our financial statements during the period in which any impairment of our goodwill, other intangible assets or other assets is determined, which would negatively impact our results of operations and stockholders’ equity.
Risks Relating to Litigation, Reputation and Insurance
We are subject to risks related to litigation.
We are subject to a number of disputes, claims, litigation and other legal proceedings as described in this report, and any unfavorable rulings or outcomes in current or future litigation and other legal proceedings may materially harm our business. For additional information, see our Commitments and Contingencies note (Note 14) in the notes to our financial statements.
We are subject to risks related to human trafficking allegations.
Our business, along with the hospitality industry generally, faces risk that could cause damage to our reputation and the value of our hotel brands due to claims related to purported incidents of human trafficking. Along with many of our competitors, we and/or certain of our subsidiaries have been named as defendants in litigation matters filed in state and federal courts (and incurred litigation-related fees and costs), alleging statutory and common law claims arising from purported incidents of human trafficking perpetrated by third parties at certain franchised and managed hotel facilities. For additional information, see our Commitments and Contingencies note (Note 14) in the notes to our financial statements.
The insurance we carry may not always pay, or be sufficient to pay or reimburse us, for our liabilities, losses or replacement costs.
We carry insurance for general liability, property, business interruption and other insurable risks with respect to our business and franchised, managed and owned hotels. We also self-insure for certain risks up to certain monetary limits. The insurance coverage we carry, subject to our deductible, may not be sufficient to pay or reimburse us for the amount of our liabilities, losses or replacement costs, and there may also be risks for which we do not obtain insurance in the full amount, or some amount, or at all concerning a potential loss or liability, due to the cost or availability of such insurance. Additionally, actual or anticipated losses resulting from the consequences of climate change could also impact the cost or availability of insurance. As a result, we may incur liabilities or losses in the operation of our business that are not sufficiently covered by the insurance we maintain, or at all, which could have a material adverse effect on our business, financial condition and results of operations.
Risks Relating to Our Common Stock and Corporate Governance
The market price of our common stock may continue to fluctuate.
The market price for our common stock, and the market price of stock of other companies operating in the hospitality industry, has been highly volatile. For example, during the year ended December 31, 2021, the trading price of our common stock ranged between a low sales price of $57.34 and a high sales price of $90.18. The market price of our common stock may continue to fluctuate depending upon many factors, some of which may be beyond our control, including the effects of ongoing COVID-19 on our operations and financial performance, our ability to achieve growth and performance objectives, the success or failure of our business strategy, general economic conditions, our quarterly or annual earnings and those of
other companies in our industry, changes in financial estimates and recommendations by securities analysts, changes in laws and regulations, political instability, increased competition and changes affecting the travel industry and other events impacting our business. The stock market in general has experienced volatility that has often been unrelated to the operating performance of a particular company. These market fluctuations may adversely affect the trading price of our common stock.
Certain of our Directors and executive officers may have actual or potential conflicts of interest because of their ownership of Travel + Leisure equity or their current or former positions at Travel + Leisure.
Two of our Directors also serve on the Travel + Leisure Board and certain of our executive officers and non-employee Directors own shares of Travel + Leisure common stock because of their current or former positions with Travel + Leisure. This could create, or appear to create, potential conflicts of interest when our or Travel + Leisure’s management, officers and directors face decisions that could have different implications for us and Travel + Leisure.
We are subject to risks related to corporate social responsibility.
Our business, along with the hospitality industry generally, faces scrutiny related to environmental, social and governance activities and the risk of damage to our reputation and the value of our hotel brands if we fail to act responsibly or comply with regulatory requirements in a number of areas, such as safety and security, responsible tourism, environmental stewardship, supply chain management, climate change, diversity and inclusion, philanthropy and support for local communities. In particular, our stakeholders (notably our customers, stockholders and team members) are increasingly interested in our approach to managing climate-related risks and opportunities (including, but not limited to, targets that keep global average temperature rise to no more than 1.5°C, measure Scope 3 franchisee emissions and expand participation in the Wyndham Green Certification program) and may directly impact our revenue associated with both franchisee and management fees.
Provisions in our corporate governance documents and Delaware law may prevent or delay an acquisition of our business, which could decrease the market price of our common stock.
Our corporate governance documents and Delaware law contain provisions that are intended to deter or delay coercive takeover practices and inadequate takeover bids, including requiring advance notice for stockholder proposals, placing limitations on convening stockholder meetings, and authorizing our Board to issue one or more series of preferred stock. Additionally, Delaware law also imposes some restrictions on mergers and other business combinations between us and any holder of 15% or more of our outstanding common stock. These provisions may prevent or delay an acquisition that some stockholders may consider beneficial, which could decrease the market price of our common stock.
Our second amended and restated by-laws designate the Court of Chancery of the State of Delaware as the sole and exclusive forum for certain types of actions and proceedings that may be initiated by our stockholders, which could limit our stockholders’ ability to obtain a favorable judicial forum for disputes with us or our Directors or employees.
Our second amended and restated by-laws provide that, subject to limited exceptions, the Court of Chancery of the State of Delaware will be the sole and exclusive forum for derivative actions; claims related to a breach of a fiduciary duty, corporate law, our second amended and restated certificate of incorporation or our second amended and restated bylaws; or under the internal affairs doctrine. This choice of forum provision may limit a stockholder’s ability to bring a claim in a judicial forum that it finds favorable for disputes with us or our Directors or employees, which may discourage such lawsuits. Alternatively, if a court were to find this provision of our second amended and restated by-laws inapplicable or unenforceable with respect to one or more of the specified types of actions or proceedings, we may incur additional costs associated with resolving such matters in other jurisdictions, which could materially and adversely affect our business, financial condition and results of operations and result in a diversion of the time and resources of our management and Board.
We may not continue to pay dividends on, or effect repurchases of, our common stock, and the terms of our indebtedness could limit our ability to pay dividends on our common stock.
The declaration and payment of dividends and share repurchases are at the sole discretion of our Board and will depend on, among other things, our results of operations, cash requirements, financial condition, contractual restrictions under our indebtedness and other factors that our Board may deem relevant. Though we expect to make regular dividends, there can be no assurance that a payment of a dividend will occur in the future.
Beginning with the dividend that was declared by the Board during the second quarter of 2020, and as a result of the financial impact of COVID-19, our Board approved a reduction in the quarterly cash dividend policy from $0.32 per share to $0.08 per share. However, in February 2021, we announced the Board’s approval of an increase in the quarterly cash
dividend policy to $0.16 per share, in July 2021, we announced the Board’s approval of an increase in the quarterly cash dividend to $0.24 per share and in October 2021, we announced the Board’s approval of an increase in the quarterly cash dividend to $0.32 per share. Additionally, in response to COVID-19, we suspended our share repurchase activity and agreed to restrict repurchasing shares of our stock as a condition of the April 2020 amendment to our revolving credit agreement, which restriction expired on April 1, 2021. We resumed our share repurchases in the third quarter of 2021.
Risks Relating to the Spin-Off
In connection with the spin-off and Travel + Leisure’s sale of its European vacation rentals business, we agreed to indemnify Travel + Leisure and Travel + Leisure agreed to indemnify us for certain liabilities, and if we are required to perform under these indemnities or if Travel + Leisure is unable to satisfy its obligations under these indemnities, our financial results could be negatively affected.
The contingent liabilities we assumed in connection with the spin-off and Travel + Leisure’s sale of its European vacation rentals business could adversely affect our results of operations and financial condition. In connection with the spin-off, Travel + Leisure agreed to indemnify us for certain liabilities, and we agreed to indemnify Travel + Leisure for certain liabilities, including cross-indemnities that are principally designed to place financial responsibility for the obligations and liabilities of our business with us, and financial responsibility for the obligations and liabilities of Travel + Leisure’s business with Travel + Leisure. Pursuant to the Separation and Distribution Agreement (the “SDA”), we assumed one-third and Travel + Leisure assumed two-thirds of certain contingent and other corporate liabilities of Travel + Leisure, which we refer to in this report as “shared contingent liabilities,” incurred prior to the spin-off, including liabilities of Travel + Leisure related to, arising out of or resulting from certain terminated or divested businesses, certain general corporate and tax matters of Travel + Leisure and any actions with respect to the spin-off brought by any third party.
Additionally, in connection with the sale of Travel + Leisure’s European vacation rentals business, we provided certain post-closing credit support in the form of guarantees, which as of December 31, 2021 were approximately $127 million, to ensure that the business meets the requirements of certain service providers and regulatory authorities. Such post-closing credit support may be enforced or called upon if the European vacation rentals business fails to meet its primary obligation to pay certain amounts when due. The European vacation rentals business has provided an indemnity to Travel + Leisure in the event that the post-closing credit support is enforced or called upon. Pursuant to the terms of the SDA, we assumed one-third and Travel + Leisure assumed two-thirds of any such losses actually incurred by Travel + Leisure or us in the event that these credit support arrangements are enforced or called upon by any beneficiary and any amounts paid by Travel + Leisure or us in respect of any indemnification claims made in connection with the sale of the European vacation rentals business.
Should our indemnification obligations exceed applicable insurance coverage, our business, financial condition and results of operations could be adversely affected. Additionally, the indemnities from Travel + Leisure may not be sufficient to protect us against the full amount of these and other liabilities. Third parties also could seek to hold us responsible for any of the liabilities that Travel + Leisure has agreed to assume. Even if we ultimately succeed in recovering from Travel + Leisure any amounts for which we are held liable, we may be temporarily required to bear those losses ourselves. Each of these risks could negatively affect our business, financial condition, results of operations and cash flows.
The spin-off and related transactions may expose us to potential liabilities arising out of state and federal fraudulent conveyance laws and legal distribution requirements.
Although we received a solvency opinion from an investment bank confirming that we and Travel + Leisure were adequately capitalized immediately after the spin-off, the spin-off could be challenged under various state and federal fraudulent conveyance laws. An unpaid creditor could claim that Travel + Leisure did not receive fair consideration or reasonably equivalent value in the spin-off, and that the spin-off left Travel + Leisure insolvent or with unreasonably small capital or that Travel + Leisure intended or believed it would incur debts beyond its ability to pay such debts as they mature. If a court were to void the spin-off as a fraudulent transfer, it could impose a number of different remedies, including, returning our assets or your shares in our company to Travel + Leisure or providing Travel + Leisure with a claim for money damages against us in an amount equal to the difference between the consideration received by Travel + Leisure and the fair market value of our Company at the time of the spin-off.
If the spin-off, together with certain related transactions, were to fail to qualify as a reorganization for U.S. federal income tax purposes under Sections 368(a)(1)(D) and 355 of the Code, then our stockholders, we and Travel + Leisure might be required to pay substantial U.S. federal income taxes.
The spin-off was conditioned upon Travel + Leisure’s receipt of opinions of its spin-off tax advisors to the effect that, subject to the assumptions and limitations described in the opinions, the spin-off, together with certain related transactions,
would qualify as a reorganization for U.S. federal income tax purposes under Sections 368(a)(1)(D) and 355 of the Internal Revenue Code of 1986, as amended (the “Code”), in which no gain or loss would be recognized by Travel + Leisure or its stockholders, except, in the case of Travel + Leisure stockholders, for cash received in lieu of fractional shares, which opinions were delivered on the closing date of the spin-off. The opinions of the spin-off tax advisors are not binding on the Internal Revenue Service (“IRS”) or a court, and there can be no assurance that the IRS will not challenge the validity of the spin-off and such related transactions as a reorganization for U.S. federal income tax purposes under Sections 368(a)(1)(D) and 355 of the Code eligible for tax-free treatment, or that any such challenge ultimately will not prevail.
In addition, Travel + Leisure received certain rulings from the IRS regarding certain U.S. federal income tax aspects of transactions related to the spin-off. Although the IRS Ruling generally is binding on the IRS, the continued validity of the IRS Ruling is based upon and subject to the continuing accuracy of factual statements and representations made to the IRS by Travel + Leisure.
If the spin-off does not qualify as a tax-free transaction for any reason, including as a result of a breach of a representation or covenant with respect to such tax opinions or the IRS Ruling, Travel + Leisure would recognize a substantial gain attributable to our hotel business for U.S. federal income tax purposes. In such case, under U.S. Treasury regulations, each member of the Travel + Leisure consolidated group at the time of the spin-off, including us and certain of our subsidiaries, would be jointly and severally liable for the entire resulting amount of any U.S. federal income tax liability.
Item 1B. Unresolved Staff Comments.
None.
Item 2. Properties.
Our corporate headquarters is located in a leased office at 22 Sylvan Way, Parsippany, New Jersey, with the lease expiring in 2029. We also lease space for our reservation center and data warehouse in Saint John, New Brunswick, Canada pursuant to a lease that expires in 2029. In addition, we have an additional 10 leases for office space in 8 countries outside the United States and no additional leases within the United States. We will evaluate the need to renew each lease on a case-by-case basis prior to its expiration.
Our owned hotel portfolio, which is part of our Hotel Management segment, currently consists of (i) the Wyndham Grand Rio Mar Beach Resort and Spa in Puerto Rico, located in Rio Grande, Puerto Rico, and (ii) the Wyndham Grand Orlando Bonnet Creek, located in Orlando, Florida. Aside from these hotels, we do not own any of the approximately 9,000 properties within our franchised and managed portfolio.
We believe our current leased and owned properties are adequate to support our existing operations.
Item 3. Legal Proceedings.
We are involved in various claims, legal and regulatory proceedings and governmental inquiries arising in the ordinary course of business, none of which, in the opinion of management, is expected to have a material adverse effect on our financial condition. See Note 14 - Commitments and Contingencies to the Consolidated Financial Statements contained in Part IV of this report for a description of claims and legal actions arising in the ordinary course of our business.
Item 4. Mine Safety Disclosures.
Not applicable.
PART II
Item 5. Market for Registrant’s Common Equity, Related Stockholder Matters and Issuer Purchases of Equity Securities.
| | |
| MARKET PRICE OF COMMON STOCK |
Our common stock is listed on the New York Stock Exchange (“NYSE”) under the symbol “WH”. As of January 31, 2022, the number of stockholders of record was 4,480.
We declared cash dividends of $0.32 per share in the fourth quarter of 2021, which is consistent with our pre-pandemic quarterly dividend per share. Additionally, we declared cash dividends of $0.24 per share in the third quarter of 2021, and $0.16 per share in the first and second quarters of 2021 resulting in an aggregate of $83 million during 2021.
In response to COVID-19, our Board approved a reduction in the quarterly cash dividend from $0.32 per share to $0.08 per share, beginning with the dividend that was declared during the second quarter of 2020.
The declaration and payment of future dividends to holders of our common stock is at the discretion of our Board and depends upon many factors, including our financial condition, earnings, capital requirements of our business, covenants associated with certain debt obligations, legal requirements, regulatory constraints, industry practice and other factors that our Board deems relevant.
| | |
| ISSUER PURCHASES OF EQUITY SECURITIES |
In May 2018, our Board authorized a stock repurchase program that enables us to repurchase up to $300 million of our common stock. In August 2019, our Board increased the capacity of the program by $300 million. In February 2022, our Board increased our share repurchase authorization by an additional $400 million. Below is a summary of our common stock repurchases, excluding fees and expenses, by month for the quarter ended December 31, 2021:
| | | | | | | | | | | | | | | | | | | | | | | | | | |
| Period | | Total Number of Shares Purchased | | Average Price Paid per Share | | Total Number of Shares Purchased as Part of Publicly Announced Plan | | Approximate Dollar Value of Shares that May Yet Be Purchased Under Plan |
| October | | 226,162 | | | $ | 82.39 | | | 226,162 | | | $ | 145,279,605 | |
| November | | 319,162 | | | 84.58 | | | 319,162 | | | 118,285,306 | |
| December | | 448,862 | | | 83.08 | | | 448,862 | | | 80,995,226 | |
| Total | | 994,186 | | | $ | 83.40 | | | 994,186 | | | $ | 80,995,226 | |
The following graph compares the cumulative total stockholder return of our common stock against the S&P 500 Index and the S&P Hotels, Resorts & Cruise Lines Index (consisting of Carnival Corporation, Marriott International Inc., Norwegian Cruise Line Holdings Ltd., Royal Caribbean Cruises Ltd. and Hilton Worldwide Holdings Inc.) for the period from June 1, 2018 to December 31, 2021. The graph assumes that $100 was invested on June 1, 2018 (the first day of regular-way trading) and all dividends and other distributions were reinvested. The Stock Performance Graph is not deemed filed with the Securities and Exchange Commission (“SEC”) and shall not be deemed incorporated by reference into any of our prior or future filings made with the SEC.
Cumulative Total Return
| | | | | | | | | | | | | | | | | | | | | | | | | | | | | |
| June 1,
2018 | | December 31, 2018 | | December 31, 2019 | | December 31, 2020 | | December 31, 2021 |
| Wyndham Hotels & Resorts, Inc. | $ | 100.00 | | | $ | 74.91 | | | $ | 105.93 | | | $ | 101.61 | | | $ | 155.06 | |
| S&P 500 | $ | 100.00 | | | $ | 93.72 | | | $ | 123.23 | | | $ | 145.90 | | | $ | 187.79 | |
| S&P Hotels, Resorts & Cruise Lines | $ | 100.00 | | | $ | 84.58 | | | $ | 115.92 | | | $ | 85.92 | | | $ | 102.97 | |
Item 6. Reserved.
Item 7. Management’s Discussion and Analysis of Financial Condition and Results of Operations.
(Unless otherwise noted, all amounts are in millions, except share and per share amounts)
References herein to “Wyndham Hotels,” the “Company,” “we,” “our” and “us” refer to both (i) Wyndham Hotels & Resorts, Inc. and its consolidated subsidiaries for time periods following the consummation of the spin-off and (ii) the Wyndham Hotels & Resorts businesses for time periods prior to the consummation of our spin-off from Wyndham Worldwide (“former Parent”), now known as Travel + Leisure Co.
The Company is a leading global hotel franchisor, licensing its renowned hotel brands to hotel owners in approximately 95 countries around the world.
The Company operates in the following segments:
• Hotel Franchising — licenses our lodging brands and provides related services to third-party hotel owners and others.
• Hotel Management — provides hotel management services for full-service and limited-service hotels as well as two hotels that are owned by us. Upon sale of the CorePoint management business to Highgate, the Company will no longer provide hotel management services to limited-service hotels.
The Consolidated Financial Statements presented herein have been prepared on a stand-alone basis. The Consolidated Financial Statements include the Company’s assets, liabilities, revenues, expenses and cash flows and all entities in which it has a controlling financial interest.
Discussed below are our key operating statistics, consolidated results of operations and the results of operations for each of our reportable segments. The reportable segments presented below represent our operating segments for which discrete financial information is available and used on a regular basis by our chief operating decision maker to assess performance and to allocate resources. In identifying our reportable segments, we also consider the nature of services provided by our operating segments. Management evaluates the operating results of each of our reportable segments based upon net revenues and adjusted EBITDA. Adjusted EBITDA is defined as net income/(loss) excluding net interest expense, depreciation and amortization, early extinguishment of debt charges, impairment charges, restructuring and related charges, contract termination costs, transaction-related items (acquisition-, disposition- or separation-related), foreign currency impacts of highly inflationary countries, stock-based compensation expense, income taxes and development advance notes amortization. We believe that adjusted EBITDA is a useful measure of performance for our segments and, when considered with U.S. Generally Accepted Accounting Principles (“GAAP”) measures, gives a more complete understanding of our operating performance. We use this measure internally to assess operating performance, both absolutely and in comparison to other companies, and to make day to day operating decisions, including in the evaluation of selected compensation decisions. Adjusted EBITDA is not a recognized term under U.S. GAAP and should not be considered as an alternative to net income or other measures of financial performance or liquidity derived in accordance with U.S. GAAP. Our presentation of adjusted EBITDA may not be comparable to similarly-titled measures used by other companies. During the first quarter of 2021, we modified the definition of adjusted EBITDA to exclude the amortization of development advance notes to reflect how our chief operating decision maker reviews operating performance beginning in 2021. We have applied the modified definition of adjusted EBITDA to all periods presented.
We generate royalties and franchise fees, management fees and other revenues from hotel franchising and hotel management activities, as well as fees from licensing our “Wyndham” trademark, certain other trademarks and intellectual property. In addition, pursuant to our franchise and management contracts with third-party hotel owners, we generate marketing, reservation and loyalty fee revenues and cost-reimbursement revenues that over time are offset, respectively, by the marketing, reservation and loyalty costs and property operating costs that we incur.
COVID-19
During 2020, the hotel industry experienced a sharp decline in travel demand due to COVID-19 and the related government preventative and protective actions to slow the spread of the virus, including travel restrictions. We and the entire industry experienced significant revenue losses in 2020 as a result of steep RevPAR declines. Yet, the impact on our business was mitigated by characteristics unique to our business model. With approximately 70% of bookings at our hotels being leisure-oriented, our hotel owners are less reliant on business travel, which only makes up approximately 30% of bookings. Within this business segment, corporate transient and group bookings are the smallest component, where less than 5% of our bookings come from this segment. Our business customers are substantially comprised of truckers, contractors, construction workers, utility crews and others whose office is the road and who do not have the ability to conduct their work remotely. These customers provide a steady state of business for the majority of our hotel owners and, in fact, our infrastructure accounts, which represent 70% of the domestic business demand that our brands drive, contributed 10% more revenue to our U.S. hotels during the second half of 2021 than the same period in 2019, a trend that we see continuing given the passage of President Biden’s infrastructure bill late last year. In addition, nearly 90% of hotels within our U.S. system are located along highways and in suburban and small metro areas, on the way to or near outdoor destinations such as national parks and beach communities. Our hotels are in locations that travelers felt safe visiting and we invested in sales and marketing efforts to reach travel seekers and instill confidence that our hotels were clean, safe and welcoming guests. Finally, over 95% of our U.S. business is originated domestically. As a result, our platform was naturally set up to capture returning demand throughout the pandemic and the recovery and our business was able to substantially recover from COVID’s impact during 2021.
Our economy and midscale brands in the U.S. have outperformed the industry’s higher-end chain scales consistently since the onset of the pandemic and have led the industry’s recovery in 2021. Our RevPAR recovered to 97% of 2019 levels in the U.S. International recovery has trailed the U.S. due to a heavier reliance on cross boarder travel and localized travel restrictions at various points throughout the year. However, we have experienced significant improvement over the last few quarters and international RevPAR, on a constant currency basis, has recovered to 78% of its pre-pandemic levels during the second half of 2021 compared to 56% in the first half of this year. Our 2021 adjusted EBITDA recovered to 95% of pre-pandemic 2019 levels.
The Company does not anticipate the pandemic to further materially impact the results from operations, however should there be a resurgence of COVID-19, our results of operations may be negatively impacted and certain intangible assets, such as our trademarks, and our franchised and managed goodwill may be exposed to impairments. For further discussion on the effect of COVID-19 on our financial condition and liquidity, see the section below Financial Condition, Liquidity and Capital Resources.
| | |
| OPERATING STATISTICS - 2021 VS. 2020 |
The table below presents our operating statistics for the years ended December 31, 2021 and 2020. “Rooms” represent the number of hotel rooms at the end of the period which are either under franchise and/or management agreements, or are Company-owned, and properties under affiliation agreements for which we receive a fee for reservation and/or other services provided. “RevPAR” represents revenue per available room and is calculated by multiplying average occupancy rate by average daily rate. “Average royalty rate” represents the average royalty rate earned on our franchised properties and is calculated by dividing total royalties, excluding the impact of amortization of development advance notes, by total room revenues. These operating statistics are drivers of our revenues and therefore provide an enhanced understanding of our business. Refer to the section below for a discussion as to how these operating statistics affected our business for the periods presented.
| | | | | | | | | | | | | | | | | |
| Year Ended December 31, |
| 2021 | | 2020 | | % Change |
Rooms | | | | | |
United States | 490,600 | | | 487,300 | | | 1 | % |
International | 319,500 | | | 308,600 | | | 4 | % |
Total rooms | 810,100 | | | 795,900 | | | 2 | % |
RevPAR | | | | | |
United States | $ | 45.19 | | | $ | 30.20 | | | 50 | % |
International (a) | 21.52 | | | 15.35 | | | 40 | % |
Global RevPAR (a) | 35.95 | | | 24.51 | | | 47 | % |
Average Royalty Rate | | | | | |
United States | 4.6 | % | | 4.5 | % | | 2 | % |
International | 2.1 | % | | 2.1 | % | | — | % |
Global average royalty rate | 4.1 | % | | 4.0 | % | | 3 | % |
______________________
(a)Excluding currency effects, international RevPAR increased 36% and global RevPAR increased 46%.
Rooms as of December 31, 2021 increased 2% compared to the prior year. As expected, we experienced strong growth in the higher RevPAR midscale and above chain scales in the U.S., increasing system size by 5%, as well as strong growth in the direct franchising business in China, which grew 15%.
Global RevPAR for the year ended December 31, 2021 increased 47% to $35.95, compared to the prior year due to the ongoing recovery in travel demand. Global RevPAR recovered to 88% of 2019 levels on an annual and constant currency basis, including domestic and international RevPAR at 97% and 67%, respectively, of 2019 levels.
Global average royalty rate for the year ended December 31, 2021 increased 3% to 4.1%, compared to the prior year.
| | |
| YEAR ENDED DECEMBER 31, 2021 VS. YEAR ENDED DECEMBER 31, 2020 |
| | | | | | | | | | | | | | | | | | | | | | | |
| Year Ended December 31, |
| 2021 | | 2020 | | Change | | % Change |
| Revenues | | | | | | | |
| Fee-related and other revenues | $ | 1,245 | | | $ | 950 | | | $ | 295 | | | 31 | % |
| Cost reimbursement revenues | 320 | | | 350 | | | (30) | | | (9 | %) |
| Net revenues | 1,565 | | | 1,300 | | | 265 | | | 20 | % |
| Expenses | | | | | | | |
| Marketing, reservation and loyalty expense | 450 | | | 419 | | | 31 | | | 7 | % |
| Cost reimbursement expense | 320 | | | 350 | | | (30) | | | (9 | %) |
Other expenses | 349 | | | 577 | | | (228) | | | (40 | %) |
| Total expenses | 1,119 | | | 1,346 | | | (227) | | | (17 | %) |
| Operating income/(loss) | 446 | | | (46) | | | 492 | | | n/a |
Interest expense, net | 93 | | | 112 | | | (19) | | | (17 | %) |
| Early extinguishment of debt | 18 | | | — | | | 18 | | | n/a |
| Income/(loss) before income taxes | 335 | | | (158) | | | 493 | | | n/a |
Provision for/(benefit from) income taxes | 91 | | | (26) | | | 117 | | | n/a |
Net income/(loss) | $ | 244 | | | $ | (132) | | | $ | 376 | | | n/a |
Net revenues during 2021 increased $265 million, or 20%, compared to the prior year, primarily driven by:
•$133 million of higher royalty and franchise fees reflecting a 47% increase in global RevPAR due to the ongoing recovery in travel demand and a 2% increase in system size;
•$98 million of higher marketing, reservation and loyalty fee primarily due to the RevPAR increase;
•$53 million of higher management and other fees due to the ongoing recovery in travel demand; partially offset by
•$30 million of lower cost-reimbursement revenues in our hotel management business as a result of CorePoint Lodging asset sales.
Total expenses during 2021, decreased $227 million, or 17%, compared to the prior year, primarily driven by:
• $200 million of lower impairment charges, driven by the absence of $206 million of impairment charges during 2020, partially offset by a $6 million impairment charge in 2021 resulting from our Board’s approval of a plan to sell our two owned hotels;
•$34 million of lower restructuring charges due to the absence of cost saving initiatives implemented in 2020 in response to COVID-19;
•$30 million of lower cost-reimbursement expenses consistent with the revenue decline discussed above;
•$12 million of lower transaction-related expenses; partially offset by
•$31 million of higher marketing, reservation and loyalty expenses primarily due to the ongoing recovery in travel demand; and
•$23 million of higher operating expenses primarily associated with the recovery in travel demand at our owned hotels.
Interest expense, net during 2021 decreased $19 million, or 17%, compared to the prior year and early extinguishment of debt was $18 million in 2021 as a result of the redemption of our $500 million 5.375% senior notes in April 2021.
Our effective tax rate increased to 27.2% on pre-tax income from 16.5% on pre-tax loss during 2021 and 2020, respectively. The change was primarily related to valuation allowances for certain tax attributes and impact of foreign taxes, including withholding taxes on international operations. In 2020, we had goodwill impairment charges that were nondeductible for tax purposes which decreased the effective tax rate.
As a result of these items, net income during 2021, increased $376 million compared to the prior year.
A reconciliation of net income/(loss) to adjusted EBITDA is represented below:
| | | | | | | | | | | |
| Year Ended December 31, |
| 2021 | | 2020 (a) |
| Net income/(loss) | $ | 244 | | | $ | (132) | |
| Provision for/(benefit from) income taxes | 91 | | | (26) | |
Depreciation and amortization | 95 | | | 98 | |
Interest expense, net | 93 | | | 112 | |
| Early extinguishment of debt | 18 | | | — | |
Stock-based compensation expense | 28 | | | 19 | |
| Development advance notes amortization | 11 | | | 9 | |
| Impairments, net | 6 | | | 206 | |
Separation-related expenses | 3 | | | 2 | |
Restructuring costs | — | | | 34 | |
Transaction-related expenses, net | — | | | 12 | |
Foreign currency impact of highly inflationary countries | 1 | | | 2 | |
Adjusted EBITDA | $ | 590 | | | $ | 336 | |
______________________(a)Adjusted EBITDA for 2020 has been recasted to conform with the current year presentation.
Following is a discussion of the results of each of our segments and Corporate and Other for 2021 compared to 2020:
| | | | | | | | | | | | | | | | | | | | | | | | | | | | | | | | | | | |
| Net Revenues | | Adjusted EBITDA |
| 2021 | | 2020 | | % Change | | 2021 | | 2020 (a) | | % Change |
Hotel Franchising | $ | 1,099 | | | $ | 863 | | | 27 | % | | $ | 592 | | | $ | 392 | | | 51 | % |
Hotel Management | 466 | | | 437 | | | 7 | % | | 57 | | | 13 | | | 338 | % |
Corporate and Other | — | | | — | | | n/a | | (59) | | | (69) | | | (14 | %) |
Total Company | $ | 1,565 | | | $ | 1,300 | | | 20 | % | | $ | 590 | | | $ | 336 | | | 76 | % |
______________________(a)Adjusted EBITDA for 2020 has been recasted to conform with the current year presentation.
Hotel Franchising
| | | | | | | | | | | | | | | | | |
| Year Ended December 31, |
| 2021 | | 2020 | | % Change |
Rooms | | | | | |
United States | 465,100 | | | 452,600 | | | 3 | % |
International | 304,300 | | | 293,900 | | | 4 | % |
Total rooms | 769,400 | | | 746,500 | | | 3 | % |
RevPAR | | | | | |
United States | $ | 43.95 | | | $ | 29.50 | | | 49 | % |
International (a) | 20.86 | | | 14.75 | | | 41 | % |
Global RevPAR (a) | 34.85 | | | 23.74 | | | 47 | % |
______________________
(a) Excluding currency effects, international RevPAR increased 37% and global RevPAR increased 46%.
Net revenues during 2021 increased $236 million, or 27% compared to the prior year, primarily driven by:
•$127 million of higher royalty and franchise fees driven by the ongoing recovery in travel demand, its impact on global RevPAR and increase in our system size; and
•$98 million of higher marketing, reservation and loyalty revenues, driven by the ongoing recovery in travel demand.
Adjusted EBITDA during 2021 increased $200 million, or 51%, compared to the prior year, driven by revenue increases discussed above, partially offset by $36 million of higher expenses primarily due to higher marketing, reservation and loyalty expense and other volume-related expenses.
Hotel Management
| | | | | | | | | | | | | | | | | |
| Year Ended December 31, |
| 2021 | | 2020 | | % Change |
Rooms | | | | | |
United States | 25,500 | | | 34,700 | | | (27 | %) |
International | 15,200 | | | 14,700 | | | 3 | % |
Total rooms | 40,700 | | | 49,400 | | | (18 | %) |
RevPAR | | | | | |
United States | $ | 63.20 | | | $ | 37.97 | | | 66 | % |
International (a) | 34.31 | | | 26.21 | | | 31 | % |
Global RevPAR (a) | 53.81 | | | 34.67 | | | 55 | % |
______________________
(a) Excluding currency effects, international RevPAR increased 30% and global RevPAR increased 55%.
Net revenues during 2021 increased $29 million, or 7%, compared to the prior year, primarily driven by:
•$45 million of higher owned hotel revenues due to the ongoing recovery in travel demand;
•$8 million of higher management fees due to the ongoing recovery in travel demand; and
•$4 million of higher termination fees primarily related to CorePoint asset sales; partially offset by
•$30 million of lower cost-reimbursement revenues as discussed above, which have no impact on adjusted EBITDA.
Adjusted EBITDA during 2021 increased $44 million, or 338%, compared to the prior year, primarily driven by the higher owned hotel revenues discussed above, partially offset by higher volume-related expenses primarily related to our owned hotels.
Corporate and Other
Adjusted EBITDA during 2021 was favorable by $10 million compared to the prior year, primarily due to lower general and administrative costs.
| | |
| OPERATING STATISTICS - 2020 VS. 2019 |
The table below presents our operating statistics for the years ended December 31, 2020 and 2019. “Rooms” represent the number of hotel rooms at the end of the period which are either under franchise and/or management agreements, or are Company-owned, and properties under affiliation agreements for which we receive a fee for reservation and/or other services provided. “RevPAR” represents revenue per available room and is calculated by multiplying average occupancy rate by average daily rate. “Average royalty rate” represents the average royalty rate earned on our franchised properties and is calculated by dividing total royalties, excluding the impact of amortization of development advance notes, by total room revenues. These operating statistics are drivers of our revenues and therefore provide an enhanced understanding of our business. Refer to the section below for a discussion as to how these operating statistics affected our business for the periods presented.
| | | | | | | | | | | | | | | | | |
| Year Ended December 31, |
| 2020 | | 2019 | | % Change |
Rooms | | | | | |
United States | 487,300 | | | 510,200 | | | (4 | %) |
International | 308,600 | | | 320,800 | | | (4 | %) |
Total rooms | 795,900 | | | 831,000 | | | (4 | %) |
RevPAR | | | | | |
United States | $ | 30.20 | | | $ | 46.39 | | | (35 | %) |
International (a) | 15.35 | | | 31.85 | | | (52 | %) |
Global RevPAR (a) | 24.51 | | | 40.92 | | | (40 | %) |
Average Royalty Rate | | | | | |
United States | 4.5 | % | | 4.5 | % | | — | % |
International | 2.1 | % | | 2.0 | % | | 5 | % |
Global average royalty rate | 4.0 | % | | 3.8 | % | | 5 | % |
______________________
(a)Excluding currency effects, international RevPAR decreased 51% and global RevPAR decreased 40%.
Rooms as of December 31, 2020 decreased 4% compared to the prior year reflecting our previously announced strategic termination plan as well as the unforeseen sale of certain hotels by a strategic partner which triggered the termination of that underlying license agreement. As a result of these unusual termination events, we removed approximately 26,700 hotel rooms during 2020, which adversely impacted net room growth by 300 basis points.
Global RevPAR for the year ended December 31, 2020 decreased 40% to $24.51, compared to the prior year due to COVID-19 and its impact on travel demand.
| | |
| YEAR ENDED DECEMBER 31, 2020 VS. YEAR ENDED DECEMBER 31, 2019 |
| | | | | | | | | | | | | | | | | | | | | | | |
| Year Ended December 31, |
| 2020 | | 2019 | | Change | | % Change |
| Revenues | | | | | | | |
| Fee-related and other revenues | $ | 950 | | | $ | 1,430 | | | $ | (480) | | | (34 | %) |
| Cost reimbursement revenues | 350 | | | 623 | | | (273) | | | (44 | %) |
| Net revenues | 1,300 | | | 2,053 | | | (753) | | | (37 | %) |
Expenses | | | | | | | |
| Marketing, reservation and loyalty expense | 419 | | | 563 | | | (144) | | | (26 | %) |
| Cost reimbursement expense | 350 | | | 623 | | | (273) | | | (44 | %) |
| Other expenses | 577 | | | 560 | | | 17 | | | 3 | % |
| Total expenses | 1,346 | | | 1,746 | | | (400) | | | (23 | %) |
| Operating (loss)/income | (46) | | | 307 | | | (353) | | | (115 | %) |
Interest expense, net | 112 | | | 100 | | | 12 | | | 12 | % |
| (Loss)/income before income taxes | (158) | | | 207 | | | (365) | | | (176 | %) |
(Benefit from)/provision for income taxes | (26) | | | 50 | | | (76) | | | (152 | %) |
Net (loss)/income | $ | (132) | | | $ | 157 | | | $ | (289) | | | (184 | %) |
Net revenues during 2020 decreased $753 million, or 37%, compared to the prior year, primarily driven by:
•$273 million of lower cost-reimbursement revenues in our hotel management business as a result of CorePoint Lodging asset sales and the termination of unprofitable hotel-management agreements during 2019;
•$152 million of lower royalty and franchise fees reflecting a 40% decline in RevPAR due to lower travel demand as a result of COVID-19;
•$192 million of lower marketing, reservation and loyalty fees (inclusive of a $13 million benefit in loyalty revenues from a change in our member redemption assumption) due to the RevPAR decline;
•$61 million of lower management and other fees due to a (i) $52 million reduction in owned hotel revenues and (ii) $29 million of lower management fees resulting from a decline in RevPAR primarily due to lower travel demand from COVID-19, partially offset by the absence of a $20 million fee credit for past services with a customer in 2019; and
•$47 million of lower license and other fees due to lower travel demand resulting from COVID-19.
Total expenses during 2020, decreased $400 million, or 23%, compared to the prior year, primarily driven by:
• $273 million of lower cost-reimbursement expenses consistent with the revenue decline discussed above;
•$144 million of lower marketing, reservation and loyalty expenses primarily due to cost reductions in response to COVID-19;
•$69 million of lower operating and general and administrative expenses primarily due to cost containment efforts in response to COVID-19;
•$48 million of lower separation and transaction-related expenses;
•$42 million of lower contract termination costs; partially offset by
•$161 million of higher impairment charges, driven by the $206 million of impairment charges during 2020, primarily related to certain of our trademarks, principally La Quinta, as well as goodwill for our owned hotel reporting unit, partially offset by the absence of a $45 million impairment charge in 2019. The 2020 trademark impairments were primarily due to a higher discount rate as a result of increased share price volatility, consistent with the lodging sector and broader equity markets; and
• $26 million of higher restructuring charges due to cost saving initiatives implemented in response to COVID-19.
Our effective tax rate decreased to 16.5% on pre-tax loss from 24.2% on pre-tax income during 2020 and 2019, respectively. The effective tax rate in 2020 was lower primarily due to valuation allowances established for certain tax attributes. In 2019, the Company had higher foreign taxes on international operations, which was partially offset by a one-time state tax benefit resulting from a change in the Company’s state income tax filing position due to its spin-off from former Parent.
As a result of these items, net income during 2020, decreased $289 million compared to the prior year.
A reconciliation of net income/(loss) to adjusted EBITDA is represented below:
| | | | | | | | | | | |
| Year Ended December 31, |
| 2020 | | 2019 |
| Net (loss)/income | $ | (132) | | | $ | 157 | |
| (Benefit from)/provision for income taxes | (26) | | | 50 | |
Depreciation and amortization | 98 | | | 109 | |
Interest expense, net | 112 | | | 100 | |
Stock-based compensation expense | 19 | | | 15 | |
| Development advance notes amortization | 9 | | | 8 | |
| Impairments, net | 206 | | | 45 | |
Restructuring costs | 34 | | | 8 | |
Transaction-related expenses, net | 12 | | | 40 | |
Separation-related expenses | 2 | | | 22 | |
Contract termination costs | — | | | 42 | |
Transaction-related item | — | | | 20 | |
Foreign currency impact of highly inflationary countries | 2 | | | 5 | |
Adjusted EBITDA (a) | $ | 336 | | | $ | 621 | |
______________________(a)Adjusted EBITDA for 2020 and 2019 has been recasted to conform with the current year presentation.
Following is a discussion of the results of each of our segments and Corporate and Other for 2020 compared to 2019:
| | | | | | | | | | | | | | | | | | | | | | | | | | | | | | | | | | | |
| Net Revenues | | Adjusted EBITDA (a) |
| 2020 | | 2019 | | % Change | | 2020 | | 2019 | | % Change |
Hotel Franchising | $ | 863 | | | $ | 1,279 | | | (33 | %) | | $ | 392 | | | $ | 629 | | | (38 | %) |
Hotel Management | 437 | | | 768 | | | (43 | %) | | 13 | | | 66 | | | (80 | %) |
Corporate and Other | — | | | 6 | | | n/a | | (69) | | | (74) | | | 7 | % |
Total Company | $ | 1,300 | | | $ | 2,053 | | | (37 | %) | | $ | 336 | | | $ | 621 | | | (46 | %) |
______________________(a)Adjusted EBITDA for 2020 and 2019 has been recasted to conform with the current year presentation.
Hotel Franchising
| | | | | | | | | | | | | | | | | |
| Year Ended December 31, |
| 2020 | | 2019 | | % Change |
Rooms | | | | | |
United States | 452,600 | | | 464,600 | | | (3 | %) |
International | 293,900 | | | 305,600 | | | (4 | %) |
Total rooms | 746,500 | | | 770,200 | | | (3 | %) |
RevPAR | | | | | |
United States | $ | 29.50 | | | $ | 44.09 | | | (33 | %) |
International (a) | 14.75 | | | 30.80 | | | (52 | %) |
Global RevPAR (a) | 23.74 | | | 38.91 | | | (39 | %) |
______________________
(a) Excluding currency effects, international RevPAR decreased 52% and global RevPAR decreased 39%.
Net revenues during 2020 decreased $416 million, or 33% compared to the prior year, primarily driven by:
•$190 million of lower marketing, reservation and loyalty revenues (inclusive of a $13 million benefit in loyalty revenues from a change in our member redemption assumption) due primarily to a 39% decline in RevPAR due to lower travel demand as a result of COVID-19;
•$156 million of lower royalty and franchise fees due to the decline in RevPAR; and
•$47 million of lower license and other fees due to lower travel demand as a result of COVID-19.
Adjusted EBITDA during 2020 decreased $237 million, or 38%, compared to the prior year, primarily driven by the changes in net revenues discussed above, partially offset by:
•$145 million of lower marketing, reservation and loyalty expenses primarily due to cost reductions in response to COVID-19; and
• $34 million of lower operating and general and administrative expenses primarily due to cost containment efforts in response to COVID-19.
Hotel Management
| | | | | | | | | | | | | | | | | |
| Year Ended December 31, |
| 2020 | | 2019 | | % Change |
Rooms | | | | | |
United States | 34,700 | | | 45,600 | | | (24 | %) |
International | 14,700 | | | 15,200 | | | (3 | %) |
Total rooms | 49,400 | | | 60,800 | | | (19 | %) |
RevPAR | | | | | |
United States | $ | 37.97 | | | $ | 67.32 | | | (44 | %) |
International (a) | 26.21 | | | 52.69 | | | (50 | %) |
Global RevPAR (a) | 34.67 | | | 64.01 | | | (46 | %) |
______________________
(a) Excluding currency effects, international RevPAR decreased 49% and global RevPAR decreased 45%.
Net revenues during 2020 decreased $331 million, or 43%, compared to the prior year, primarily driven by:
•$273 million of lower cost-reimbursement revenues as discussed above, which have no impact on adjusted EBITDA;
•$61 million of lower management and other fees due to a (i) $52 million reduction in owned hotel revenues and (ii) $29 million of lower management fees resulting from a decline in RevPAR primarily due to lower travel demand from COVID-19, partially offset by the absence of a $20 million fee credit for past services with a customer in 2019; partially offset by
•$6 million of higher termination fees related to CorePoint Lodging asset sales.
Adjusted EBITDA during 2020 decreased $53 million, or 80%, compared to the prior year, primarily driven by the revenue decreases discussed above, excluding the absence of a $20 million fee credit for past services with a customer in 2019 which had no impact on adjusted EBITDA, partially offset by $28 million in lower operating expenses primarily due to cost containment efforts in response to COVID-19.
Corporate and Other
Corporate and Other revenues decreased $6 million during 2020 compared to 2019, due to the completion of transition services previously in place following our separation from former Parent.
Adjusted EBITDA during 2020 increased $5 million compared to the prior year, primarily due to $10 million in lower operating and general and administrative costs primarily due to cost containment efforts in response to COVID-19, partially offset by the $6 million decrease in net revenues discussed above.
The following selected historical consolidated statement of income/(loss) data for the years ended December 31, 2021, 2020 and 2019 and the selected historical consolidated balance sheet data as of December 31, 2021 and 2020 are derived from the audited Consolidated Financial Statements of Wyndham Hotels & Resorts included elsewhere in this report. The selected historical consolidated and combined statement of income/(loss) data for the years ended December 31, 2018 and 2017 and the selected historical consolidated and combined balance sheet data as of December 31, 2019, 2018 and 2017 are derived from audited consolidated and combined financial statements of Wyndham Hotels & Resorts businesses that are not included in this report.
The selected historical consolidated and combined financial data below should be read together with the audited Consolidated Financial Statements of Wyndham Hotels & Resorts, including the notes thereto and the other financial information included elsewhere in this report.
| | | | | | | | | | | | | | | | | | | | | | | | | | | | | | | | | | | | | | | | | | | | | | | |
| | As of or For the Year Ended December 31, |
| ($ in millions, except per share amounts and RevPAR) | | 2021 | | 2020 | | 2019 | | 2018 (a) | | 2017 (b) |
| Statement of Income/(Loss) data: | | | | | | | | | | | | | | | |
| Revenues | | | | | | | | | | | | | | | |
| Fee-related and other revenues | | $ | 1,245 | | | $ | 950 | | | $ | 1,430 | | | $ | 1,282 | | | $ | 1,016 | |
| Cost reimbursement revenues | | | 320 | | | | 350 | | | | 623 | | | | 586 | | | | 264 | |
| Net revenues | | | 1,565 | | | | 1,300 | | | | 2,053 | | | | 1,868 | | | | 1,280 | |
| Expenses | | | | | | | | | | | | | | | |
| Marketing, reservation and loyalty expense | | | 450 | | | | 419 | | | | 563 | | | | 486 | | | | 373 | |
| Cost reimbursement expense | | | 320 | | | | 350 | | | | 623 | | | | 586 | | | | 264 | |
| Other expenses | | | 349 | | | | 577 | | | | 560 | | | | 513 | | | | 394 | |
| Total expenses | | | 1,119 | | | | 1,346 | | | | 1,746 | | | | 1,585 | | | | 1,031 | |
| Operating income/(loss) | | | 446 | | | | (46) | | | | 307 | | | | 283 | | | | 249 | |
| Interest expense, net | | | 93 | | | | 112 | | | | 100 | | | | 60 | | | | 6 | |
| Early extinguishment of debt | | | 18 | | | | — | | | | — | | | | — | | | | — | |
| Income/(loss) before income taxes | | | 335 | | | | (158) | | | | 207 | | | | 223 | | | | 243 | |
| Provision for/(benefit from) income taxes | | | 91 | | | | (26) | | | | 50 | | | | 61 | | | | 13 | |
| Net income/(loss) | | $ | 244 | | | $ | (132) | | | $ | 157 | | | $ | 162 | | | $ | 230 | |
| Per share data: | | | | | | | | | | | | | | | |
Diluted earnings/(loss) per share (c) | | $ | 2.60 | | | $ | (1.42) | | | $ | 1.62 | | | $ | 1.62 | | | $ | 2.31 | |
| Cash dividends declared per share | | | 0.88 | | | | 0.56 | | | | 1.16 | | | | 0.75 | | | | — | |
| | | | | | | | | | | | | | | |
| Balance Sheet data: | | | | | | | | | | | | | | | |
| Cash | | $ | 171 | | | $ | 493 | | | $ | 94 | | | $ | 366 | | | $ | 57 | |
Total assets (d) | | | 4,269 | | | | 4,644 | | | | 4,533 | | | | 4,976 | | | | 2,137 | |
Total debt (d) | | | 2,084 | | | | 2,597 | | | | 2,122 | | | | 2,141 | | | | 184 | |
Total liabilities (d) | | | 3,180 | | | | 3,681 | | | | 3,321 | | | | 3,558 | | | | 875 | |
Total stockholders’ / invested equity (e) | | | 1,089 | | | | 963 | | | | 1,212 | | | | 1,418 | | | | 1,262 | |
| | | | | | | | | | | | | | | |
| Other financial data: | | | | | | | | | | | | | | | |
| Royalties and franchise fees | | $ | 461 | | | $ | 328 | | | $ | 480 | | | $ | 441 | | | $ | 364 | |
| License and other fees | | | 79 | | | | 84 | | | | 131 | | | | 111 | | | | 75 | |
Adjusted EBITDA (f) | | | | | | | | | | | | | | | |
| Hotel Franchising segment | | $ | 592 | | | $ | 392 | | | $ | 629 | | | $ | 521 | | | $ | 409 | |
| Hotel Management segment | | | 57 | | | | 13 | | | | 66 | | | | 47 | | | | 21 | |
Corporate and Other (g) | | | (59) | | | | (69) | | | | (74) | | | | (55) | | | | (40) | |
Total adjusted EBITDA (h) | | $ | 590 | | | $ | 336 | | | $ | 621 | | | $ | 513 | | | $ | 390 | |
| | | | | | | | | | | | | | | |
| Operating statistics: | | | | | | | | | | | | | | | |
| Total Company | | | | | | | | | | | | | | | |
Number of properties (i) | | | 8,950 | | | | 8,941 | | | | 9,280 | | | | 9,157 | | | | 8,422 | |
Number of rooms (j) | | | 810,100 | | | | 795,900 | | | | 831,000 | | | | 809,900 | | | | 728,200 | |
RevPAR (k) | | $ | 35.95 | | | $ | 24.51 | | | $ | 40.92 | | | $ | 40.80 | | | $ | 37.63 | |
Average royalty rate (l) | | | 4.1% | | | 4.0% | | | 3.8% | | | 3.8% | | | 3.7% |
| United States | | | | | | | | | | | | | | | |
Number of properties (i) | | | 6,139 | | | | 6,175 | | | | 6,342 | | | | 6,358 | | | | 5,726 | |
Number of rooms (j) | | | 490,600 | | | | 487,300 | | | | 510,200 | | | | 506,100 | | | | 440,100 | |
RevPAR (k) | | $ | 45.19 | | | $ | 30.20 | | | $ | 46.39 | | | $ | 45.30 | | | $ | 41.04 | |
Average royalty rate (l) | | | 4.6% | | | 4.5% | | | 4.5% | | | 4.5% | | | 4.4% |
______________________
(a) In May 2018, we acquired La Quinta Holdings’ hotel franchise and hotel-management business, spanning a portfolio of over 900 La Quinta-branded hotels.
(b) As described in Note 2 - Summary of Significant Accounting Polices to the Consolidated Financial Statements contained in Part II, Item 8 of this report, we adopted the new accounting standard related to revenue recognition utilizing the full retrospective transition method on January 1, 2018.
(c) On June 1, 2018, our separation from former Parent was effected through a tax-free distribution to former Parent’s stockholders of one share of our common stock for every one share of former Parent common stock held as of the close of business on May 18, 2018. As a result, on June 1, 2018, we had 99.8 million shares of common stock outstanding (inclusive of deferred shares and shares that vested upon separation). This share amount is being utilized for the calculation of basic and diluted earnings per share for all periods presented prior to the date of separation.
(d) Reflects the impact of the adoption of the new accounting standard in 2020 for the measurement of credit losses on financial instruments and the 2019 accounting standard for lease accounting.
(e) Represents the Company’s stand-alone stockholders’ equity since May 31, 2018 and former Parent net investment (capital contributions and earnings from operations less dividends) in the Company and accumulated other comprehensive income for 2017 through May 31, 2018, the date of our spin-off.
(f) “Adjusted EBITDA” is defined as net income/(loss) excluding net interest expense, depreciation and amortization, early extinguishment of debt charges, impairment charges, restructuring and related charges, contract termination costs, transaction-related items (acquisition-, disposition- or separation-related), foreign currency impacts of highly inflationary countries, stock-based compensation expense, income taxes and development advance notes amortization. We believe that adjusted EBITDA is a useful measure of performance for our segments which, when considered with U.S. Generally Accepted Accounting Principles (“GAAP”) measures, allows a more complete understanding of our operating performance. We use this measure internally to assess operating performance, both absolutely and in comparison to other companies, and to make day to day operating decisions, including in the evaluation of selected compensation decisions. Our presentation of adjusted EBITDA may not be comparable to similarly-titled measures used by other companies. During the first quarter of 2021, the Company modified the definition of adjusted EBITDA to exclude the amortization of development advance notes to reflect how the Company’s chief operating decision maker reviews operating performance beginning in 2021. The Company has applied the modified definition of adjusted EBITDA to all periods presented.
(g) Corporate and Other reflects unallocated corporate costs that are not attributable to an operating segment.
(h) The reconciliation of net income/(loss) to adjusted EBITDA is as follows:
| | | | | | | | | | | | | | | | | | | | | | | | | | | | | |
| Year Ended December 31, |
| (in millions) | 2021 | | 2020 (a) | | 2019 (a) | | 2018 (a) | | 2017 (a) |
| Net income/(loss) | $ | 244 | | | $ | (132) | | | $ | 157 | | | $ | 162 | | | $ | 230 | |
| Provision for/(benefit from) income taxes | 91 | | | (26) | | | 50 | | | 61 | | | 13 | |
| Depreciation and amortization | 95 | | | 98 | | | 109 | | | 99 | | | 75 | |
| Interest expense, net | 93 | | | 112 | | | 100 | | | 60 | | | 6 | |
| Early extinguishment of debt | 18 | | | — | | | — | | | — | | | — | |
| Stock-based compensation expense | 28 | | | 19 | | | 15 | | | 9 | | | 11 | |
| Development advance notes amortization | 11 | | | 9 | | | 8 | | | 7 | | | 6 | |
| Impairments, net | 6 | | | 206 | | | 45 | | | — | | | 41 | |
| Separation-related expenses | 3 | | | 2 | | | 22 | | | 77 | | | 3 | |
| Restructuring costs | — | | | 34 | | | 8 | | | — | | | 1 | |
| Transaction-related expenses, net | — | | | 12 | | | 40 | | | 36 | | | 3 | |
| Contract termination costs | — | | | — | | | 42 | | | — | | | — | |
| Transaction-related item | — | | | — | | | 20 | | | — | | | — | |
| Foreign currency impact of highly inflationary countries | 1 | | | 2 | | | 5 | | | 3 | | | — | |
| Adjusted EBITDA | $ | 590 | | | $ | 336 | | | $ | 621 | | | $ | 513 | | | $ | 390 | |
______________________
(a) Adjusted EBITDA has been recasted to conform with the current year presentation. Amounts may not foot due to rounding.
(i) Represents the number of hotels at the end of the period.
(j) Represents the number of rooms at the end of the period which are (i) either under franchise and/or management agreements, or are Company-owned and (ii) properties under affiliation agreements for which the Company receives a fee for reservation and/or other services provided.
(k) Represents revenue per available room and is calculated by multiplying the average occupancy rate by the average daily rate.
(l) Represents the average royalty rate earned on our franchised properties and is calculated by dividing total royalties, excluding the impact of amortization of development advance notes, by total room revenues.
In presenting the financial data above in conformity with U.S. GAAP, we are required to make estimates and assumptions that affect the amounts reported. See “Management’s Discussion and Analysis of Financial Condition and Results of Operations–Financial Condition, Liquidity and Capital Resources–Critical Accounting Policies,” for a detailed discussion of the accounting policies that we believe require subjective and complex judgments that could potentially affect reported results.
We awarded 655 new contracts this year, compared to 581 in 2020. As of December 31, 2021, our global development pipeline consisted of over 1,500 hotels and over 194,000 rooms, the highest level on record. Our pipeline grew 5% compared to 2020, including 3% domestically and 6% internationally. As of December 31, 2021, approximately 65% of our development pipeline was international and 79% was new construction, of which approximately 35% has broken ground. Over 80% of our global development pipeline was in midscale and above segments, including over 70% in the U.S.
We did not incur restructuring charges during 2021.
We incurred $34 million of charges related to restructuring initiatives implemented in response to COVID-19 during 2020. These initiatives resulted in a reduction of 846 employees and were comprised primarily of employee separation and facility closure costs. In addition, during 2019, we implemented restructuring initiatives, primarily focused on enhancing our organizational efficiency and rationalizing our operations. During 2020, we paid $30 million in restructuring payments relating to our 2019 and 2020 plans. As of December 31, 2020, we had a $10 million liability related to our 2020 restructuring plans which was paid in 2021.
During 2019, we recorded $8 million of charges related to restructuring initiatives, primarily focused on enhancing our organizational efficiency and rationalizing our operations. These initiatives resulted in a reduction of 58 employees and were comprised of employee separation costs. The charges were recorded primarily to the Corporate and Other segment. During 2019, we made no material cash payments related to this initiative. The remaining liability of $8 million as of December 31, 2019 was paid during 2020.
| | |
| FINANCIAL CONDITION, LIQUIDITY AND CAPITAL RESOURCES |
Financial Condition
| | | | | | | | | | | | | | | | | |
| Year Ended December 31, |
| 2021 | | 2020 | | Change |
Total assets | $ | 4,269 | | | $ | 4,644 | | | $ | (375) | |
Total liabilities | 3,180 | | | 3,681 | | | (501) | |
Total stockholders’ equity | 1,089 | | | 963 | | | 126 | |
Total assets decreased $375 million from December 31, 2020 to December 31, 2021 primarily due to a reduction in cash as a result of the redemption of our $500 million 2026 senior notes, partially offset by cash generated from operations. Total liabilities decreased $501 million from December 31, 2020 to December 31, 2021 primarily due to the redemption of our senior notes (discussed above). Total equity increased $126 million from December 31, 2020 to December 31, 2021 primarily due to our net income for the year, partially offset by stock repurchases and dividend payments.
Liquidity and Capital Resources
Historically, our business generates sufficient cash flow to not only support our current operations as well as our future growth needs and dividend payments to our stockholders, but also to create additional value for our stockholders in the form of share repurchases or business investment. However, due to the negative impact that COVID-19 was having on the travel industry, in 2020 we took a number of preventative steps to conserve our liquidity and strengthen our balance sheet:
•In March 2020, we suspended share repurchase activity;
•In April 2020, we amended our revolving credit facility agreement to waive the quarterly-tested leverage covenant until April 1, 2021. The covenant was also modified for the second, third and fourth quarters of 2021 to use a form of annualized EBITDA, as defined in the credit agreement, rather than the last twelve months EBITDA, as previously required;
•In May 2020, we decreased our quarterly cash dividend to $0.08 per share; and
•In August 2020, we issued $500 million of senior unsecured notes, which mature in 2028 and bear interest at a rate of 4.375% per year, for net proceeds of $492 million, which were used to repay a portion of the then outstanding borrowings under our revolving credit facility.
As a result of our confidence in the continued recovery of travel demand, we have taken the following actions in 2021:
•In the first quarter of 2021, we increased our quarterly cash dividend to $0.16 per share, followed by a subsequent increase in July to $0.24 per share and a final increase in October to the pre-pandemic quarterly payout of $0.32 per share;
•On April 15, 2021, we redeemed all $500 million of our outstanding 5.375% senior notes due in 2026, primarily from cash on hand. We expect this redemption to reduce our annual cash interest expense by approximately $27 million. Coupled with the issuance of 4.375% senior notes in August 2020, this redemption effectively returns our balance sheet to pre-pandemic debt and liquidity levels while extending $500 million of maturity by approximately 2.5 years at a 100 basis point or 19% lower interest rate; and
•In August 2021, we resumed our share repurchase program.
As of December 31, 2021, our liquidity approximated over $900 million. Given the minimal capital needs of our business, the flexible cost infrastructure and the mitigation measures taken, we believe that our existing cash, cash equivalents, cash generated through operations and our expected access to financing facilities, together with funding through our revolving credit facility, will be sufficient to fund our operating activities, anticipated capital expenditures and growth needs. As of December 31, 2021, we were in compliance with the financial covenants of our credit agreement and expect to remain in such compliance with no additional waivers or amendments required. As of December 31, 2021, we had a term loan with an aggregate principal amount of $1.5 billion maturing in 2025 and a five-year revolving credit facility maturing in 2023 with a maximum aggregate principal amount of $750 million, of which none was outstanding and $15 million was allocated to outstanding letters of credit. The interest rate per annum applicable to our term loan is equal to, at our option, either a base rate plus a margin of 0.75% or LIBOR plus a margin of 1.75%.
Our revolving credit facility is subject to an interest rate per annum equal to, at our option, either a base rate plus a margin ranging from 0.50% to 1.00% or LIBOR plus a margin ranging from 1.50% to 2.00%, in either case based upon the total leverage ratio of the Company and its restricted subsidiaries. During the amendment period as discussed above, the revolving credit facility was subject to an interest rate per annum equal to, at our option, either a base rate plus a margin of 1.25% or LIBOR plus a margin of 2.25% with the LIBOR rate subject to a 0.50% floor. The amendment period expired on April 1, 2021.
As of December 31, 2021, $1.1 billion of our term loan is hedged with pay-fixed/receive-variable interest rate swaps hedging our term loan interest rate exposure. The aggregate fair value of these interest rate swaps was a $23 million liability as of December 31, 2021.
The Federal Reserve has established the Alternative Reference Rates Committee to identify alternative reference rates for when the U.S. dollar LIBOR ceases to exist after June 2023. Our credit facility, which includes our revolving credit facility and term loan, gives us the option to use LIBOR as a base rate and our interest rate swaps are based on the one-month U.S. dollar LIBOR rate. In the event that LIBOR is no longer published, the credit facility allows us and the administrative agent of the facility to replace LIBOR with an alternative benchmark rate, subject to the right of the majority of the lenders to object thereto. We anticipate that we will amend and extend the revolving credit portion of the credit facility during the first half of 2022 for which Secured Overnight Funding Rate (“SOFR”) will be utilized as the new benchmark rate. In addition, the International Swaps and Derivatives Association issued protocols to allow swap parties to amend their existing contracts, though the Company’s existing swaps will continue to reference LIBOR for the foreseeable future.
As of December 31, 2021, our credit rating was Ba1 from Moody’s Investors Service and BB+ from Standard and Poor’s Rating Agency. A credit rating is not a recommendation to buy, sell or hold securities and is subject to revision or withdrawal by the assigning rating organization. Reference in this report to any such credit rating is intended for the limited purpose of discussing or referring to aspects of our liquidity and of our costs of funds. Any reference to a credit rating is not intended to be any guarantee or assurance of, nor should there be any undue reliance upon, any credit rating or change in credit rating, nor is any such reference intended as any inference concerning future performance, future liquidity or any future credit rating.
Our liquidity and access to capital may be impacted by our credit ratings, financial performance and global credit market conditions. We believe that our existing cash, cash equivalents, cash generated through operations and our expected access to financing facilities, together with funding through our revolving credit facility, will be sufficient to fund our operating activities, anticipated capital expenditures and growth needs.
The following table summarizes the changes in cash, cash equivalents and restricted cash during the years ended December 31, 2021, 2020 and 2019:
| | | | | | | | | | | | | | | | | |
| Year Ended December 31, |
| 2021 | | 2020 | | 2019 |
Cash provided by/(used in) | | | | | |
Operating activities | $ | 426 | | | $ | 67 | | | $ | 100 | |
Investing activities | (34) | | | (31) | | | (53) | |
Financing activities | (713) | | | 363 | | | (320) | |
Effects of changes in exchange rates on cash, cash equivalents and restricted cash | (1) | | | — | | | 1 | |
Net change in cash, cash equivalents and restricted cash | $ | (322) | | | $ | 399 | | | $ | (272) | |
During 2021, net cash provided by operating activities increased $359 million compared to the prior year primarily due to higher net income (excluding non-cash impairments and depreciation expense) in 2021 as well as favorable collections experience, including collection of fee deferrals related to COVID-19 and working capital management, partially offset by $14 million of higher net payments for development advance notes. Net cash used in investing activities increased $3 million compared to the prior year, primarily due to higher property and equipment additions. Net cash used in financing activities increased $1.1 billion compared to the prior year. This change reflects borrowing activities in 2020 out of an abundance of caution in connection with the pandemic and repayment activities in 2021 as our business began to experience recovery. Specifically, in 2020, we issued $500 million of 4.375% senior unsecured notes; while in 2021, we redeemed $500 million of higher-cost, nearer maturity debt effectively replacing it with the August 2020 issuance of lower-cost, longer maturity debt.
During 2020, net cash provided by operating activities decreased $33 million compared to the prior year primarily due to lower net income (excluding non-cash impairment and depreciation expenses) in 2020 and timing of deferred revenues associated with our Wyndham Rewards co-branded credit card program, partially offset by the absence of payment of $195 million of tax liabilities assumed in the La Quinta acquisition during 2019. 2020 also included $66 million of cash outlays related to restructuring, contract termination costs and transaction and separation related costs, while 2019 included $113 million of such costs. Net cash used in investing activities decreased $22 million compared to the prior year, primarily due to lower property and equipment additions in connection with our COVID-19 cost containment initiative. As a result of the impact of COVID-19 on travel demand, we prioritized our capital projects to focus on guest-facing projects with the higher return potential. Net cash provided by financing activities increased $683 million compared to the prior year, primarily due to the issuance of our $500 million 4.375% senior unsecured notes due in 2028, suspension of our share repurchase activity in March 2020 and reduction of our quarterly cash dividend in the second quarter of 2020 and throughout the remainder of the year from $0.32 per share to $0.08 per share.
Capital Deployment
Our first priority is to invest in the business. This includes deploying capital to attract high quality assets into our system, investing in select technology improvements across our business that further our strategic objectives and competitive position, brand refresh programs to improve quality and protect brand equity, business acquisitions that are accretive and strategically enhancing to our business, and/or other strategic initiatives. We also expect to maintain a regular dividend payment. Excess cash generated beyond these needs would be available for enhanced stockholder return in the form of stock repurchases.
During 2021, we spent $37 million on capital expenditures, primarily related to information technology. During 2022, we anticipate spending approximately $45 million on capital expenditures.
In addition, during 2021, we spent $30 million, net of repayments on development advance notes. During 2022, we anticipate spending approximately $55 million on development advance notes. We may also provide other forms of financial support.
We expect all our cash needs to be funded from cash on hand and cash generated through operations, and/or availability under our revolving credit facility.
Contractual Obligations
Material contractual obligations arising in the normal course of business primarily consist of long-term debt and related interest payments, purchase commitments and lease payments. See Note 12 - Long-Term Debt and Borrowing Arrangements and Note 19 - Leases to the Consolidated Financial Statements contained in Part IV of this report for more information. As of December 31, 2021, we had future long-term interest payment obligations of approximately $343 million of which $77 million is payable within twelve months. We have purchase commitments primarily consisting of non-cancelable obligations for marketing and technology related services. As of December 31, 2021, we had purchase commitments of $157 million of which $58 million is payable within twelve months.
Stock Repurchase Program
In May 2018, our Board approved a share repurchase plan pursuant to which we were authorized to purchase up to $300 million of our common stock. In August 2019, the Board increased the capacity of the program by $300 million. Under the plan, we may, from time to time, purchase our common stock through various means, including, without limitation, open market transactions, privately negotiated transactions or tender offers, subject to the terms of the tax matters agreement entered into in connection with our spin-off.
Due to our confidence in our ability to generate significant cash flow, the resiliency of our business model and the ongoing recovery of travel demand, we resumed our share repurchase program in August of 2021. Under our current stock repurchase program, we repurchased approximately 1.4 million shares at an average price of $80.60 per share for a cost of $110 million during 2021. Since inception, we repurchased 9.0 million shares at an average price of $57.55 per share for a cost of $519 million. As of December 31, 2021, we had $81 million of remaining availability under our program. In February 2022, our Board increased the capacity of the program by an additional $400 million.
Dividend Policy
We declared cash dividends of $0.32 per share in the fourth quarter of 2021, which is consistent with our pre-pandemic quarterly dividend per share. Additionally, we declared cash dividends of $0.24 per share in the third quarter of 2021, and $0.16 per share in the first and second quarters of 2021 resulting in an aggregate of $83 million during 2021.
In response to COVID-19, our Board approved a reduction in the quarterly cash dividend from $0.32 per share to $0.08 per share, beginning with the dividend that was declared during the second quarter of 2020.
The declaration and payment of future dividends to holders of our common stock is at the discretion of our Board and depends upon many factors, including our financial condition, earnings, capital requirements of our business, covenants associated with certain debt obligations, legal requirements, regulatory constraints, industry practice and other factors that our Board deems relevant.
Foreign Earnings
Although the one-time mandatory deemed repatriation tax during 2017 and the territorial tax system created as a result of U.S. tax reform generally eliminate U.S. federal income taxes on dividends from foreign subsidiaries, we continue to assert that all of our undistributed foreign earnings of $24 million will be reinvested indefinitely as of December 31, 2021. In the event the Company determines not to continue to assert that all or part of its undistributed foreign earnings are permanently reinvested, such a determination in the future could result in the accrual and payment of additional foreign withholding taxes and U.S. taxes on currency transaction gains and losses, the determination of which is not practicable due to the complexities associated with the hypothetical calculation.
Our credit facilities contain customary covenants that, among other things, impose limitations on indebtedness; liens; mergers, consolidations, liquidations and dissolutions; dispositions, restricted debt payments, restricted payments and transactions with affiliates. Events of default in these credit facilities include, among others, failure to pay interest, principal and fees when due; breach of a covenant or warranty; acceleration of or failure to pay other debt in excess of a threshold amount; unpaid judgments in excess of a threshold amount, insolvency matters; and a change of control. The credit facilities require us to comply with a financial covenant to be tested quarterly, consisting of a maximum first-lien leverage ratio of 5.0 times. The ratio is calculated by dividing consolidated first lien indebtedness (as defined in the credit agreement) net of consolidated unrestricted cash as of the measurement date by consolidated EBITDA (as defined in the credit agreement), as measured on a trailing four-fiscal-quarter basis preceding the measurement date.
In April 2020, we completed an amendment to our revolving credit facility agreement to waive the quarterly-tested leverage covenant until April 1, 2021. The covenant was also modified for the second, third and fourth quarters of 2021 to use a form of annualized EBITDA, as defined in the credit agreement, rather than the last twelve months EBITDA, as previously required. However, during this period we never exceeded the maximum first-lien leverage ratio of 5.0 times. As of December 31, 2021, our annualized first-lien leverage ratio was 2.2 times.
The indenture, as supplemented, under which the senior notes due 2028 were issued, contains covenants that limit, among other things, our ability and that of certain of our subsidiaries to (i) create liens on certain assets; (ii) enter into sale and leaseback transactions; and (iii) merge, consolidate or sell all or substantially all of our assets. These covenants are subject to a number of important exceptions and qualifications.
As of December 31, 2021, we were in compliance with the financial covenants described above.
While the hotel industry is seasonal in nature, periods of higher revenues vary property-by-property and performance is dependent on location and guest base. Based on historical performance, revenues from franchise and management contracts are generally higher in the second and third quarters than in the first or fourth quarters due to increased leisure travel during the spring and summer months. Our cash provided by operating activities tends to be lower in the first half of the year and substantially higher in the second half of the year. However, given the impact of COVID-19 in 2020, our second quarter was the most severely impacted and as such, we had higher revenues and cash flows in the third and fourth quarters. However, during 2021, our revenues and cash provided by operating activities returned to the historic seasonality as our business recovered from the pandemic. The seasonality of our business may cause fluctuations in our quarterly operating results, earnings, profit margins and cash flows. As we expand into new markets and geographical locations, we may experience increased or different seasonality dynamics that create fluctuations in operating results different from the fluctuations we have experienced in the past.
| | |
| COMMITMENTS AND CONTINGENCIES |
We are involved in claims, legal and regulatory proceedings and governmental inquiries related to our business. Litigation is inherently unpredictable and, although we believe that our accruals are adequate and/or that we have valid defenses in these matters, unfavorable results could occur. As such, an adverse outcome from such proceedings for which claims are awarded in excess of the amounts accrued, if any, could be material to us with respect to earnings and/or cash flows in any given reporting period. As of December 31, 2021, the potential exposure resulting from adverse outcomes of such legal proceedings could, in the aggregate, range up to approximately $5 million in excess of recorded accruals. However, we do not believe that the impact of such litigation should result in a material liability to us in relation to our financial position or liquidity. For a more detailed description of our commitments and contingencies see Note 14 - Commitments and Contingencies to the Consolidated Financial Statements contained in Part IV of this report.
| | |
| CRITICAL ACCOUNTING ESTIMATES AND POLICIES |
In presenting our financial statements in conformity with U.S. GAAP, we are required to make estimates and assumptions that affect the amounts reported therein. Several of the estimates and assumptions we are required to make relate to matters that are inherently uncertain as they pertain to future events. However, events that are outside of our control cannot be predicted and, as such, they cannot be contemplated in evaluating such estimates and assumptions. If there is a significant unfavorable change to current conditions, it could result in a material impact to our consolidated results of operations, financial position and liquidity. We believe that the estimates and assumptions we used when preparing our financial statements were the most appropriate at that time. Presented below are those accounting policies that we believe require subjective and complex judgments that could potentially affect reported results. However, the majority of our business activities are in environments where we are paid a fee for a service performed, and therefore the results of the majority of our recurring operations are recorded in our financial statements using accounting policies that are not particularly subjective, nor complex.
Impairment of Long-Lived Assets
Goodwill is reviewed annually (during the fourth quarter of each year subsequent to completing our annual forecasting process), or more frequently if circumstances indicate that the value of goodwill may be impaired, to the reporting units’ carrying values as required by the guidance. This is done either by performing a qualitative assessment or utilizing the one-step impairment test, with an impairment being recognized only where the fair value is less than carrying value. In any given year, we can elect to perform a qualitative assessment to determine whether it is more likely than not that the fair value of a
reporting unit is in excess of its carrying value. If it is not more likely than not that the fair value is in excess of the carrying value, or we elect to bypass the qualitative assessment, we would use the one-step impairment test. The qualitative factors evaluated include macroeconomic conditions, industry and market considerations, cost factors, overall financial performance, our historical share price as well as other industry-specific considerations.
We also determine whether the carrying values of other indefinite-lived intangible assets are impaired on an annual basis or more frequently if indicators of potential impairment exist. Application of the other indefinite-lived intangible assets impairment test requires judgment in the assumptions underlying the approach used to determine fair value. The fair value of each other indefinite-lived intangible asset is estimated using a discounted cash flow methodology. This analysis requires significant judgments, including estimation of future cash flows, which are dependent on internal forecasts, discount rates and to a lesser extent, estimation of long-term rates of growth. The estimates used to calculate the fair value of other indefinite-lived intangible assets change from year to year based on operating results and market conditions. Changes in these estimates and assumptions could materially affect the determination of fair value and the other indefinite-lived intangible assets’ impairment.
We also evaluate the recoverability of each of our definite-lived intangible assets by performing a qualitative assessment to determine if circumstances indicate that impairment may have occurred. If such circumstances exist, we perform a quantitative assessment by comparing the respective carrying value of the assets to the expected future cash flows, on an undiscounted basis, to be generated from such assets.
We also evaluate the recoverability of our other long-lived assets, including property and equipment, if circumstances indicate impairment may have occurred, pursuant to guidance for impairment or disposal of long-lived assets. This analysis is performed by comparing the respective carrying values of the assets to the current and expected future cash flows, on an undiscounted basis, to be generated from such assets. Property and equipment is evaluated separately within each segment. If such analysis indicates that the carrying value of these assets is not recoverable, the carrying value of such assets is reduced to fair value.
For more information on the impairment analyses performed on our goodwill, other indefinite-lived intangible assets, definite-lived intangible assets and other long-lived assets, see Note 7 - Property and Equipment, Net and Note 8 - Intangible Assets to the Consolidated Financial Statements contained in Part IV of this report.
Loyalty Program
We operate the Wyndham Rewards loyalty program. Wyndham Rewards members primarily accumulate points by staying in hotels operated under one of our brands. Wyndham Rewards members may also accumulate points by purchasing everyday services and products with their Wyndham Rewards co-branded credit card.
We earn revenue from these programs (i) when a member stays at a participating hotel or club resort or vacation rental from a fee charged by us to the property owner or manager, which is based upon a percentage of room revenues generated from such stay which we recognize, net of redemptions, over time based upon loyalty point redemption patterns, including an estimate of loyalty points that will expire or will never be redeemed, and (ii) based upon a percentage of the member’s spending on the Wyndham Rewards co-branded credit cards for which revenues are paid to us by a third-party issuing bank which we primarily recognize over time based upon the redemption patterns of the loyalty points earned under the program, including an estimate of loyalty points that will expire or will never be redeemed.
As members earn points through the Wyndham Rewards loyalty program, we record a liability for the estimated future redemption costs, which is calculated based on (i) an estimated cost per point and (ii) an estimated redemption rate of the overall points earned, which is determined with the assistance of a third-party actuarial firm through historical experience, current trends and the use of an actuarial analysis.
As a result of the negative impact that COVID-19 had on travel demand in 2020, our assumptions related to redemptions, including estimated member redemption rate, member redemption pattern, and the estimated cost to satisfy such redemptions, changed. Accordingly, we recognized a $16 million cumulative adjustment, which resulted in an increase to loyalty revenues during the second quarter of 2020. Such increase is included within marketing, reservation and loyalty and other revenues on the Consolidated Statement of Income/(Loss) for the year ended December 31, 2020.
Income Taxes
We recognize deferred tax assets and liabilities based on the differences between the financial statement carrying amounts and the tax basis of assets and liabilities using currently enacted tax rates. We regularly review our deferred tax
assets to assess their potential realization and establish a valuation allowance for portions of such assets that we believe will not be ultimately realized. In performing this review, we make estimates and assumptions regarding projected future taxable income, the expected timing of the reversals of existing temporary differences and the implementation of tax planning strategies. A change in these assumptions may increase or decrease our valuation allowance resulting in an increase or decrease in our effective tax rate, which could materially impact our results of operations.
For tax positions we have taken or expect to take in our tax return, we apply a more likely than not threshold, under which we must conclude a tax position is more likely than not to be sustained, assuming that the position will be examined by the appropriate taxing authority that has full knowledge of all relevant information, in order to recognize or continue to recognize the benefit. In determining our provision for income taxes, we use judgment, reflecting our estimates and assumptions, in applying the more likely than not threshold.
| | |
| RECENTLY ADOPTED AND NEW ACCOUNTING PRONOUNCEMENTS |
For a detailed description of recently adopted and new accounting pronouncements see Note 2 - Summary of Significant Accounting Policies to the Consolidated Financial Statements contained in Part IV of this report.
| | |
| OFF-BALANCE SHEET ARRANGEMENTS |
There were no off-balance sheet transactions, arrangements or other relationships with unconsolidated entities or other persons in 2021, 2020 and 2019 that have, or are reasonably likely to have, a current or future effect on our financial condition, revenues or expenses, results of operations, liquidity, capital expenditures or capital resources.
Item 7A. Quantitative and Qualitative Disclosures About Market Risk.
We use various financial instruments, including interest swap contracts, to reduce the interest rate risk related to our debt. We also use foreign currency forwards to manage and reduce the foreign currency exchange rate risk associated with our foreign currency denominated receivables and payables, forecasted royalties, forecasted earnings and cash flows of foreign subsidiaries and other transactions.
We are exclusively an end user of these instruments, which are commonly referred to as derivatives. We do not engage in trading, market making or other speculative activities in the derivatives markets. More detailed information about these financial instruments is provided in Note 13 - Fair Value to the Consolidated Financial Statements contained in Part IV of this report. Our principal market exposures are interest and currency exchange rate risks.
We assess our exposures to changes in interest rates utilizing a sensitivity analysis. The sensitivity analysis measures the potential impact in earnings, fair values and cash flows based on a hypothetical 10% change (increase and decrease) in interest rates. Our variable-rate borrowings, which include our term loan, a portion of which has been swapped to a fixed interest rate, and any borrowings we make under our revolving credit facility, expose us to risks caused by fluctuations in the applicable interest rates. The total outstanding balance of such variable-rate borrowings, net of swaps, was $448 million as of December 31, 2021. A hypothetical 10% change in our effective weighted average interest rate on our variable-rate borrowings would result in an immaterial increase or decrease to our annual long-term debt interest expense, and a one-point change in the underlying interest rates would result in approximately a $4 million increase or decrease in our annual interest expense.
The fair values of cash and cash equivalents, trade receivables, accounts payable and accrued expenses and other current liabilities approximate their carrying values due to the short-term nature of these assets and liabilities.
We have foreign currency rate exposure to exchange rate fluctuations worldwide, particularly with respect to the Canadian Dollar, the Chinese Yuan, the Euro, the British Pound, the Brazilian Real and the Argentine Peso. We anticipate that such foreign currency exchange rate risk will remain a market risk exposure for the foreseeable future.
We use a current market pricing model to assess the changes in the value of our foreign currency derivatives used by us to hedge underlying exposure that primarily consists of our non-functional-currency current assets and liabilities. The primary assumption used in these models is a hypothetical 10% weakening or strengthening of the U.S. dollar against all our currency exposures as of December 31, 2021. The gains and losses on the hedging instruments are largely offset by the gains and losses on the underlying assets, liabilities or expected cash flows. As of December 31, 2021, the absolute notional amount of our outstanding foreign exchange hedging instruments was $90 million. We have determined through such analyses, that a hypothetical 10% change in foreign currency exchange rates would have resulted in approximately a $5 million increase or
decrease to the fair value of our outstanding forward foreign currency exchange contracts, which would generally be offset by an opposite effect on the underlying exposure being economically hedged.
Argentina is considered to be a highly inflationary economy. As of December 31, 2021, we had total net assets of $3 million in Argentina.
Our total market risk is influenced by a wide variety of factors including the volatility present within the markets and the liquidity of the markets. There are certain limitations inherent in the sensitivity analyses presented. While probably the most meaningful analysis, these “shock tests” are constrained by several factors, including the necessity to conduct the analysis based on a single point in time and the inability to include the complex market reactions that normally would arise from the market shifts modeled.
Item 8. Financial Statements and Supplementary Data.
The financial statements required to be filed pursuant to this Item 8 are appended to this Annual Report on Form 10-K. A list of the financial statements filed herewith is found in Part IV, Item 15 commencing on page F-1 hereof.
Item 9. Changes in and Disagreements with Accountants on Accounting and Financial Disclosure.
Not applicable.
Item 9A. Controls and Procedures.
Disclosure Controls and Procedures. Our management, with the participation of our principal executive and principal financial officers, has evaluated the effectiveness of our disclosure controls and procedures (as such term is defined in Rule 13a-15(e) under the Securities Exchange Act of 1934, as amended (the “Exchange Act”)) as of the end of the period covered by this report. Based on such evaluation, our principal executive and principal financial officers have concluded that, as of the end of such period, our disclosure controls and procedures were effective and operating to provide reasonable assurance that information required to be disclosed by us in the reports that we file or submit under the Exchange Act is recorded, processed, summarized and reported within the time periods specified in the rules and forms of the SEC, and to provide reasonable assurance that such information is accumulated and communicated to our management, including our principal executive and principal financial officers, as appropriate, to allow timely decisions regarding required disclosure.
Management’s Report on Internal Control Over Financial Reporting. Our management is responsible for establishing and maintaining adequate internal control over financial reporting, as defined in Rule 13a-15(f) under the Exchange Act. Our management assessed the effectiveness of our internal control over financial reporting as of December 31, 2021. In making this assessment, management used the criteria established in Internal Control - Integrated Framework (2013) issued by the Committee of Sponsoring Organizations of the Treadway Commission (“COSO”). Based on this assessment, our management believes that, as of December 31, 2021, our internal control over financial reporting is effective. Our independent registered public accounting firm has issued an attestation report on the effectiveness of our internal control over financial reporting, which is included within their audit opinion on page F-2.
There have been no changes in our internal control over financial reporting (as such term is defined in Rule 13a-15(f) under the Exchange Act) during the most recent fiscal quarter to which this report relates that have materially affected or are reasonably likely to materially affect our internal control over financial reporting.
Item 9B. Other Information.
None.
Item 9C. Disclosure Regarding Foreign Jurisdictions that Prevent Inspections.
Not Applicable.
PART III
Item 10. Directors, Executive Officers and Corporate Governance.
Except as otherwise disclosed in Part I of this Annual Report on Form 10-K under the caption “Information About Our Executive Officers”, the information required by this item is included in the Proxy Statement for our 2022 Annual Meeting of Stockholders and is incorporated by reference in this report.
Item 11. Executive Compensation.
The information required by this item is included in the Proxy Statement under the captions “Compensation of Directors”, “Executive Compensation” and “Committees of the Board” and is incorporated by reference in this report.
Item 12. Security Ownership of Certain Beneficial Owners and Management and Related Stockholder Matters.
Equity compensation plan information as of December 31, 2021:
| | | | | | | | | | | |
| Plan Category | Number of Securities to be Issued Upon Exercise of Outstanding Options, Warrants and Rights | Weighted-Average Exercise Price of Outstanding Options, Warrants and Rights | Number of Securities Remaining Available for Future Issuance Under Equity Compensation Plans (Excluding Securities Reflected in the First Column) |
| Equity compensation plans approved by security holders | 2.7 million (a) | $56.04 (b) | 5.4 million (c) |
| Equity compensation plans not approved by security holders | None | Not applicable | Not applicable |
______________________
(a) Consists of shares issuable upon exercise of stock settled stock options, restricted stock units, deferred stock units and performance vested restricted stock units at the maximum achievement level under the 2018 Equity and Incentive Plan.
(b) Consists of weighted-average exercise price of outstanding stock settled stock options.
(c) Consists of shares available for future grants under the 2018 Equity and Incentive Plan.
The remaining information required by this item is included in the Proxy Statement under the caption “Ownership of Company Stock” and is incorporated by reference in this report.
Item 13. Certain Relationships and Related Transactions, and Director Independence.
The information required by this item is included in the Proxy Statement under the captions “Related Party Transactions” and “Governance of the Company” and is incorporated by reference in this report.
Item 14. Principal Accountant Fees and Services.
The information required by this item is included in the Proxy Statement under the captions “Disclosure About Fees” and “Pre-Approval of Audit and Non-Audit Services” and is incorporated by reference in this report.
PART IV
Item 15. Exhibit and Financial Statement Schedules.
Item 15 (a)(1) Financial Statements.
See Financial Statements and Financial Statements Index commencing on page F-1 hereof.
Item 15 (a)(3) Exhibits.
See Exhibit Index commencing on page G-1 hereof.
Item 16. Form 10-K Summary.
None.
SIGNATURES
Pursuant to the requirements of Section 13 or 15(d) of the Securities Exchange Act of 1934, the registrant has duly caused this report to be signed on its behalf by the undersigned, thereunto duly authorized.
| | | | | |
| WYNDHAM HOTELS & RESORTS, INC. |
| |
| By: | /s/ GEOFFREY A. BALLOTTI |
| Geoffrey A. Ballotti |
| President and Chief Executive Officer |
| (Principal Executive Officer) |
| Date: | February 16, 2022 |
Pursuant to the requirements of the Securities Exchange Act of 1934, this report has been signed below by the following persons on behalf of the registrant and in the capacities and on the dates indicated.
| | | | | | | | |
Signature | Title | Date |
| | |
/s/ GEOFFREY A. BALLOTTI | President, Chief Executive Officer and Director | February 16, 2022 |
Geoffrey A. Ballotti | (Principal Executive Officer) | |
| | |
/s/ MICHELE ALLEN | Chief Financial Officer | February 16, 2022 |
Michele Allen | (Principal Financial Officer) | |
| | |
/s/ NICOLA ROSSI | Chief Accounting Officer | February 16, 2022 |
Nicola Rossi | (Principal Accounting Officer) | |
| | |
/s/ STEPHEN P. HOLMES | Non-Executive Chairman of the Board of Directors | February 16, 2022 |
Stephen P. Holmes | |
| | |
/s/ MYRA J. BIBLOWIT | Director | February 16, 2022 |
Myra J. Biblowit | | |
| | |
/s/ JAMES E. BUCKMAN | Director | February 16, 2022 |
James E. Buckman | | |
| | |
/s/ BRUCE B. CHURCHILL | Director | February 16, 2022 |
Bruce B. Churchill | | |
| | |
/s/ MUKUL DEORAS | Director | February 16, 2022 |
Mukul Deoras | | |
| | |
/s/ RONALD L. NELSON | Director | February 16, 2022 |
Ronald L. Nelson | | |
| | |
/s/ PAULINE D.E. RICHARDS | Director | February 16, 2022 |
Pauline D.E. Richards | | |
INDEX TO ANNUAL CONSOLIDATED FINANCIAL STATEMENTS
| | | | | |
| Page |
Report of Independent Registered Public Accounting Firm (PCAOB ID No. 34) | |
| Consolidated Statements of Income/(Loss) | |
| Consolidated Comprehensive Income/(Loss) | |
| Consolidated Balance Sheets | |
| Consolidated Statements of Cash Flows | |
| Consolidated Statements of Equity | |
| Notes to Consolidated Financial Statements | |
REPORT OF INDEPENDENT REGISTERED PUBLIC ACCOUNTING FIRM
To the Board of Directors and Stockholders of
Wyndham Hotels & Resorts, Inc.
Opinions on the Financial Statements and Internal Control over Financial Reporting
We have audited the accompanying consolidated balance sheets of Wyndham Hotels & Resorts, Inc. and subsidiaries (the “Company”) as of December 31, 2021 and 2020, the related consolidated statements of income (loss), comprehensive income (loss), equity, and cash flows, for each of the three years in the period ended December 31, 2021, and the related notes (collectively referred to as the “financial statements”). We also have audited the Company’s internal control over financial reporting as of December 31, 2021, based on criteria established in Internal Control — Integrated Framework (2013) issued by the Committee of Sponsoring Organizations of the Treadway Commission (COSO).
In our opinion, the financial statements referred to above present fairly, in all material respects, the financial position of the Company as of December 31, 2021 and 2020, and the results of its operations and its cash flows for each of the three years in the period ended December 31, 2021, in conformity with accounting principles generally accepted in the United States of America. Also, in our opinion, the Company maintained, in all material respects, effective internal control over financial reporting as of December 31, 2021, based on criteria established in Internal Control — Integrated Framework (2013) issued by COSO.
Basis for Opinions
The Company’s management is responsible for these financial statements, for maintaining effective internal control over financial reporting, and for its assessment of the effectiveness of internal control over financial reporting, included in the accompanying Management's Report on Internal Control over Financial Reporting. Our responsibility is to express an opinion on these financial statements and an opinion on the Company’s internal control over financial reporting based on our audits. We are a public accounting firm registered with the Public Company Accounting Oversight Board (United States) (PCAOB) and are required to be independent with respect to the Company in accordance with the U.S. federal securities laws and the applicable rules and regulations of the Securities and Exchange Commission and the PCAOB.
We conducted our audits in accordance with the standards of the PCAOB. Those standards require that we plan and perform the audits to obtain reasonable assurance about whether the financial statements are free of material misstatement, whether due to error or fraud, and whether effective internal control over financial reporting was maintained in all material respects.
Our audits of the financial statements included performing procedures to assess the risks of material misstatement of the financial statements, whether due to error or fraud, and performing procedures to respond to those risks. Such procedures included examining, on a test basis, evidence regarding the amounts and disclosures in the financial statements. Our audits also included evaluating the accounting principles used and significant estimates made by management, as well as evaluating the overall presentation of the financial statements. Our audit of internal control over financial reporting included obtaining an understanding of internal control over financial reporting, assessing the risk that a material weakness exists, and testing and evaluating the design and operating effectiveness of internal control based on the assessed risk. Our audits also included performing such other procedures as we considered necessary in the circumstances. We believe that our audits provide a reasonable basis for our opinions.
Definition and Limitations of Internal Control over Financial Reporting
A company’s internal control over financial reporting is a process designed to provide reasonable assurance regarding the reliability of financial reporting and the preparation of financial statements for external purposes in accordance with generally accepted accounting principles. A company’s internal control over financial reporting includes those policies and procedures that (1) pertain to the maintenance of records that, in reasonable detail, accurately and fairly reflect the transactions and dispositions of the assets of the company; (2) provide reasonable assurance that transactions are recorded as necessary to permit preparation of financial statements in accordance with generally accepted accounting principles, and that receipts and expenditures of the company are being made only in accordance with authorizations of management and directors of the company; and (3) provide reasonable assurance regarding prevention or timely detection of unauthorized acquisition, use, or disposition of the company’s assets that could have a material effect on the financial statements.
Because of its inherent limitations, internal control over financial reporting may not prevent or detect misstatements. Also, projections of any evaluation of effectiveness to future periods are subject to the risk that controls may become inadequate because of changes in conditions, or that the degree of compliance with the policies or procedures may deteriorate.
Critical Audit Matter
The critical audit matter communicated below is a matter arising from the current-period audit of the financial statements that was communicated or required to be communicated to the audit committee and that (1) relates to accounts or disclosures that are material to the financial statements and (2) involved our especially challenging, subjective, or complex judgments. The communication of critical audit matters does not alter in any way our opinion on the financial statements, taken as a whole, and we are not, by communicating the critical audit matter below, providing a separate opinion on the critical audit matter or on the accounts or disclosures to which it relates.
Deferred Revenues and Liability – Wyndham Rewards Loyalty Program – Refer to Notes 2 and 3 to the financial statements
Critical Audit Matter Description
The Company operates the Wyndham Rewards loyalty program under which members earn points that can be redeemed for free nights or other rewards. Wyndham Rewards members primarily accumulate points by staying at a participating hotel, club resort or vacation rental or by making purchases with their Wyndham Rewards co-branded credit card. Revenues related to the issuance of loyalty points are recognized net of redemptions over time based upon loyalty point redemption patterns, including an estimate of loyalty points that will expire or will never be redeemed. In addition, the Company records a liability for estimated future redemption costs of outstanding loyalty points.
The Company estimates the value of the deferred revenues and related liability (collectively referred to as the “liability”) related to the loyalty program based on (i) an estimated cost per point and (ii) an estimated redemption rate of the overall points earned, which is determined with the assistance of a third-party actuarial firm through historical experience, current trends and the use of an actuarial analysis, and includes an estimate of the points that will expire or will never be redeemed. Changes in the estimated cost per point and/or the estimated redemption rate used in the determination of the liability could result in a material change to the amount of liability reported.
We identified the estimated cost per point and the estimated redemption rate used in the determination of the liability as a critical audit matter because of the significant judgments made by management to estimate the cost per point and the redemption rate. This required a high degree of auditor judgment and an increased extent of effort, including the involvement of our actuarial specialists, when performing audit procedures to evaluate the reasonableness of management’s estimates and assumptions related to the selection of the estimated cost per point and the estimated redemption rate.
How the Critical Audit Matter Was Addressed in the Audit
Our audit procedures related to the estimated cost per point and estimated redemption rate used in the determination of the liability included the following, among others:
•We tested the effectiveness of the controls related to the liability, including those over the estimate of the cost per point and the estimate of the redemption rate.
•We evaluated the assumptions used by management to estimate the cost per point by:
◦Testing the underlying data that served as the inputs for the historical cost per point, including historical redemptions.
◦Discussing with management the assumptions used in the Company’s estimated future cost per point and evaluating the reasonableness by comparing the projections to (1) forecasted information included in industry reports of the Company and its peer group, and (2) trends in Wyndham Rewards member behavior.
◦Comparing management’s prior-year estimated cost per point to actual redemptions during the current year to identify potential bias in the determination of the liability.
◦Evaluating whether the assumptions used by management to estimate the cost per point were consistent with evidence obtained in other areas of the audit.
•We evaluated the assumptions used by management to estimate the redemption rate by:
◦Testing the underlying data that served as the inputs for the actuarial analysis of the estimated redemption rate, including earnings and redemptions.
◦Evaluating whether any approved changes to the Wyndham Rewards loyalty program have been appropriately incorporated in the actuarial analysis of the estimated redemption rate.
◦Comparing management’s prior-year estimated redemption rate to actual redemptions during the current year to identify potential bias in the determination of the liability.
•With the assistance of our actuarial specialists, we developed a range of independent estimates of the liability, utilizing the same underlying data tested above, and compared our estimates to management’s estimates.
/s/ Deloitte & Touche LLP
New York, New York
February 16, 2022
We have served as the Company’s auditor since 2017.
WYNDHAM HOTELS & RESORTS, INC.
CONSOLIDATED STATEMENTS OF INCOME/(LOSS)
(In millions, except per share amounts)
| | | | | | | | | | | | | | | | | |
| Year Ended December 31, |
| 2021 | | 2020 | | 2019 |
Net revenues | | | | | |
Royalties and franchise fees | $ | 461 | | | $ | 328 | | | $ | 480 | |
Marketing, reservation and loyalty | 468 | | | 370 | | | 562 | |
| Management and other fees | 117 | | | 64 | | | 125 | |
| License and other fees | 79 | | | 84 | | | 131 | |
Other | 120 | | | 104 | | | 132 | |
Fee-related and other revenues | 1,245 | | | 950 | | 1,430 | |
| Cost reimbursements | 320 | | | 350 | | | 623 | |
| Net revenues | 1,565 | | | 1,300 | | | 2,053 | |
Expenses | | | | | |
Marketing, reservation and loyalty | 450 | | | 419 | | | 563 | |
Operating | 132 | | | 109 | | | 164 | |
General and administrative | 113 | | | 116 | | | 130 | |
Cost reimbursements | 320 | | | 350 | | | 623 | |
Depreciation and amortization | 95 | | | 98 | | | 109 | |
| Impairments, net | 6 | | | 206 | | | 45 | |
Separation-related | 3 | | | 2 | | | 22 | |
Restructuring | — | | | 34 | | | 8 | |
Transaction-related, net | — | | | 12 | | | 40 | |
| Contract termination | — | | | — | | | 42 | |
Total expenses | 1,119 | | | 1,346 | | | 1,746 | |
| Operating (loss)/income | 446 | | | (46) | | | 307 | |
Interest expense, net | 93 | | | 112 | | | 100 | |
| Early extinguishment of debt | 18 | | | — | | | — | |
| Income/(loss) before income taxes | 335 | | | (158) | | | 207 | |
Provision for/(benefit from) income taxes | 91 | | | (26) | | | 50 | |
Net income/(loss) | $ | 244 | | | $ | (132) | | | $ | 157 | |
| | | | | |
Earnings/(loss) per share | | | | | |
Basic | $ | 2.61 | | | $ | (1.42) | | | $ | 1.63 | |
| Diluted | 2.60 | | | (1.42) | | | 1.62 | |
See Notes to Consolidated Financial Statements.
F-5
WYNDHAM HOTELS & RESORTS, INC.
CONSOLIDATED STATEMENTS OF COMPREHENSIVE INCOME/(LOSS)
(In millions)
| | | | | | | | | | | | | | | | | |
| Year Ended December 31, |
| 2021 | | 2020 | | 2019 |
| Net income/(loss) | $ | 244 | | | $ | (132) | | | $ | 157 | |
| Other comprehensive income/(loss), net of tax | | | | | |
Foreign currency translation adjustments | — | | | 3 | | | 3 | |
Unrealized gains/(losses) on cash flow hedges | 37 | | | (28) | | | (22) | |
Other comprehensive income/(loss), net of tax | 37 | | | (25) | | | (19) | |
Comprehensive income/(loss) | $ | 281 | | | $ | (157) | | | $ | 138 | |
See Notes to Consolidated Financial Statements.
F-6
WYNDHAM HOTELS & RESORTS, INC.
CONSOLIDATED BALANCE SHEETS
(In millions, except per share amounts)
| | | | | | | | | | | |
| December 31, 2021 | | December 31, 2020 |
Assets | | | |
Current assets: | | | |
Cash and cash equivalents | $ | 171 | | | $ | 493 | |
Trade receivables, net | 246 | | | 295 | |
Prepaid expenses | 51 | | | 45 | |
Other current assets | 98 | | | 67 | |
| Assets held for sale | 154 | | | — | |
Total current assets | 720 | | | 900 | |
Property and equipment, net | 106 | | | 278 | |
Goodwill | 1,525 | | | 1,525 | |
Trademarks, net | 1,202 | | | 1,203 | |
Franchise agreements and other intangibles, net | 473 | | | 512 | |
Other non-current assets | 243 | | | 226 | |
Total assets | $ | 4,269 | | | $ | 4,644 | |
Liabilities and stockholders’ equity | | | |
Current liabilities: | | | |
Current portion of long-term debt | $ | 21 | | | $ | 21 | |
Accounts payable | 31 | | | 28 | |
Deferred revenues | 70 | | | 71 | |
Accrued expenses and other current liabilities | 258 | | | 226 | |
| Liabilities held for sale | 17 | | | — | |
Total current liabilities | 397 | | | 346 | |
Long-term debt | 2,063 | | | 2,576 | |
Deferred income taxes | 366 | | | 359 | |
Deferred revenues | 165 | | | 158 | |
Other non-current liabilities | 189 | | | 242 | |
Total liabilities | 3,180 | | | 3,681 | |
| Commitments and contingencies (Note 14) | | | |
Stockholders’ equity: | | | |
Preferred stock, $0.01 par value, authorized 6.0 shares, none issued and outstanding | — | | | — | |
Common stock, $0.01 par value, authorized 600.0 shares, 101.3 and 100.8 issued and outstanding at December 31, 2021 and 2020 | 1 | | | 1 | |
Treasury stock, at cost – 9.0 and 7.7 shares at December 31, 2021 and 2020 | (519) | | | (408) | |
Additional paid-in capital | 1,543 | | | 1,504 | |
| Retained earnings/(accumulated deficit) | 79 | | | (82) | |
Accumulated other comprehensive loss | (15) | | | (52) | |
Total stockholders’ equity | 1,089 | | | 963 | |
Total liabilities and stockholders’ equity | $ | 4,269 | | | $ | 4,644 | |
See Notes to Consolidated Financial Statements.
F-7
WYNDHAM HOTELS & RESORTS, INC.
CONSOLIDATED STATEMENTS OF CASH FLOWS
(In millions)
| | | | | | | | | | | | | | | | | |
| Year Ended December 31, |
| 2021 | | 2020 | | 2019 |
| Operating activities | | | | | |
| Net income/(loss) | $ | 244 | | | $ | (132) | | | $ | 157 | |
| Adjustments to reconcile net income/(loss) to net cash provided by/(used in) operating activities: | | | | | |
| Depreciation and amortization | 95 | | | 98 | | | 109 | |
| Provision for doubtful accounts | 21 | | | 37 | | | 16 | |
| Impairments, net | 6 | | | 209 | | | 45 | |
| Deferred income taxes | (1) | | | (23) | | | (14) | |
| Stock-based compensation | 28 | | | 21 | | | 20 | |
| Loss on early extinguishment of debt | 18 | | | — | | | — | |
| Net change in assets and liabilities: | | | | | |
| Trade receivables | 25 | | | (38) | | | (27) | |
| Prepaid expenses | (9) | | | 3 | | | (8) | |
| Other current assets | (45) | | | 1 | | | 7 | |
| Accounts payable, accrued expenses and other current liabilities | 39 | | | (46) | | | (28) | |
| Payment of tax liability assumed in La Quinta acquisition | — | | | — | | | (195) | |
| Deferred revenues | 16 | | | (54) | | | 33 | |
| Payments of development advance notes | (32) | | | (17) | | | (19) | |
| Proceeds from development advance notes | 2 | | | 1 | | | 2 | |
| Other, net | 19 | | | 7 | | | 2 | |
Net cash provided by operating activities | 426 | | | 67 | | | 100 | |
| Investing activities | | | | | |
| Property and equipment additions | (37) | | | (33) | | | (50) | |
| Loan advances | — | | | (1) | | | (2) | |
Loan repayments | 3 | | | 3 | | | — | |
Other, net | — | | | — | | | (1) | |
Net cash used in investing activities | (34) | | | (31) | | | (53) | |
| Financing activities | | | | | |
| Proceeds from borrowings | 45 | | | 1,244 | | | — | |
| Principal payments on long-term debt | (574) | | | (760) | | | (16) | |
| Finance lease payments | (5) | | | (5) | | | (5) | |
| Debt issuance costs | — | | | (10) | | | — | |
| Capital contribution from former Parent | — | | | — | | | 68 | |
Dividends to stockholders | (82) | | | (53) | | | (112) | |
Repurchases of common stock | (107) | | | (50) | | | (242) | |
| Exercise of stock options | 17 | | | — | | | — | |
Net share settlement of incentive equity awards | (7) | | | (4) | | | (5) | |
Other, net | — | | | 1 | | | (8) | |
Net cash (used in)/provided by financing activities | (713) | | | 363 | | | (320) | |
Effect of changes in exchange rates on cash, cash equivalents and restricted cash | (1) | | | — | | | 1 | |
| Net (decrease)/increase in cash, cash equivalents and restricted cash | (322) | | | 399 | | | (272) | |
Cash, cash equivalents and restricted cash, beginning of period | 493 | | | 94 | | | 366 | |
Cash, cash equivalents and restricted cash, end of period | $ | 171 | | | $ | 493 | | | $ | 94 | |
See Notes to Consolidated Financial Statements.
F-8
WYNDHAM HOTELS & RESORTS, INC.
CONSOLIDATED STATEMENTS OF EQUITY
(In millions)
| | | | | | | | | | | | | | | | | | | | | | | | | | | | | | | | | | | | | | | | | |
| Common Shares Outstanding | | Common Stock | | Treasury Stock | | Additional Paid-in Capital | | Retained Earnings/(Accumulated Deficit) | | Accumulated Other Comprehensive Loss | | Total Equity |
| Balance as of December 31, 2018 | 98 | | | $ | 1 | | | $ | (119) | | | $ | 1,475 | | | $ | 69 | | | $ | (8) | | | $ | 1,418 | |
| Net income | — | | | — | | | — | | | — | | | 157 | | | — | | | 157 | |
Other comprehensive loss | — | | | — | | | — | | | — | | | — | | | (19) | | | (19) | |
Dividends | — | | | — | | | — | | | — | | | (113) | | | — | | | (113) | |
Repurchase of common stock | (4) | | | — | | | (244) | | | — | | | — | | | — | | | (244) | |
Net share settlement of incentive equity awards | — | | | — | | | — | | | (5) | | | — | | | — | | | (5) | |
Change in deferred compensation | — | | | — | | | — | | | 20 | | | — | | | — | | | 20 | |
Other | — | | | — | | | — | | | (2) | | | — | | | — | | | (2) | |
| Balance as of December 31, 2019 | 94 | | | 1 | | | (363) | | | 1,488 | | | 113 | | | (27) | | | 1,212 | |
| Net loss | — | | | — | | | — | | | — | | | (132) | | | — | | | (132) | |
Other comprehensive loss | — | | | — | | | — | | | — | | | — | | | (25) | | | (25) | |
Dividends | — | | | — | | | — | | | — | | | (53) | | | — | | | (53) | |
Repurchase of common stock | (1) | | | — | | | (45) | | | — | | | — | | | — | | | (45) | |
Net share settlement of incentive equity awards | — | | | — | | | — | | | (4) | | | — | | | — | | | (4) | |
Change in deferred compensation | — | | | — | | | — | | | 21 | | | — | | | — | | | 21 | |
| Cumulative effect of change in accounting standard | — | | | — | | | — | | | — | | | (10) | | | — | | | (10) | |
Other | — | | | — | | | — | | | (1) | | | — | | | — | | | (1) | |
| Balance as of December 31, 2020 | 93 | | | 1 | | | (408) | | | 1,504 | | | (82) | | | (52) | | | 963 | |
| Net income | — | | | — | | | — | | | — | | | 244 | | | — | | | 244 | |
Other comprehensive income | — | | | — | | | — | | | — | | | — | | | 37 | | | 37 | |
Dividends | — | | | — | | | — | | | — | | | (83) | | | — | | | (83) | |
Repurchase of common stock | (2) | | | — | | | (110) | | | — | | | — | | | — | | | (110) | |
Net share settlement of incentive equity awards | — | | | — | | | — | | | (7) | | | — | | | — | | | (7) | |
Change in deferred compensation | — | | | — | | | — | | | 28 | | | — | | | — | | | 28 | |
| Exercise of stock options | — | | | — | | | — | | | 17 | | | — | | | — | | | 17 | |
| Issuance of shares for restricted stock units vesting | 1 | | | — | | | — | | | — | | | — | | | — | | | — | |
Other | — | | | — | | | (1) | | | 1 | | | — | | | — | | | — | |
| Balance as of December 31, 2021 | 92 | | | $ | 1 | | | $ | (519) | | | $ | 1,543 | | | $ | 79 | | | $ | (15) | | | $ | 1,089 | |
See Notes to Consolidated Financial Statements.
F-9
WYNDHAM HOTELS & RESORTS, INC.
NOTES TO CONSOLIDATED FINANCIAL STATEMENTS
(Unless otherwise noted, all amounts are in millions, except share and per share amounts)
Wyndham Hotels & Resorts, Inc. (collectively with its consolidated subsidiaries, “Wyndham Hotels” or the “Company”) is a leading global hotel franchisor, licensing its renowned hotel brands to hotel owners in approximately 95 countries around the world.
The Consolidated Financial Statements have been prepared on a stand-alone basis. The Consolidated Financial Statements include the Company’s assets, liabilities, revenues, expenses and cash flows and all entities in which it has a controlling financial interest. The accompanying Consolidated Financial Statements have been prepared in accordance with accounting principles generally accepted in the United States of America (“U.S. GAAP”). All intercompany balances and transactions have been eliminated in the Consolidated Financial Statements.
In presenting the Consolidated Financial Statements, management makes estimates and assumptions that affect the amounts reported and related disclosures. Estimates, by their nature, are based on judgment and available information. Accordingly, actual results could differ from those estimates. In management’s opinion, the Consolidated Financial Statements contain all normal recurring adjustments necessary for a fair presentation of annual results reported.
Business Description
The Company operates in the following segments:
• Hotel Franchising — licenses the Company’s lodging brands and provides related services to third-party hotel owners and others.
• Hotel Management — provides hotel management services for full-service and limited-service hotels as well as two hotels that are owned by the Company.
| | |
| 2. SUMMARY OF SIGNIFICANT ACCOUNTING POLICIES |
Principles of Consolidation
When evaluating an entity for consolidation, the Company first determines whether an entity is within the scope of the guidance for consolidation of variable interest entities (“VIEs”) and if it is deemed to be a VIE. If the entity is considered to be a VIE, the Company determines whether it would be considered the entity’s primary beneficiary. The Company consolidates those VIEs for which it has determined that it is the primary beneficiary. The Company will consolidate an entity not deemed a VIE upon a determination that it has a controlling financial interest. For entities where the Company does not have a controlling financial interest, the investments in such entities are classified as available-for-sale securities or accounted for using the equity or cost method, as appropriate.
Use of Estimates and Assumptions
The preparation of the Consolidated Financial Statements requires the Company to make estimates and assumptions that affect the reported amounts of assets, liabilities, revenues and expenses and the disclosure of contingent assets and liabilities in the Consolidated Financial Statements and accompanying notes. Although these estimates and assumptions are based on Company’s knowledge of current events and actions it may undertake in the future, actual results may ultimately differ from estimates and assumptions.
Revenue Recognition
The principal source of revenues from franchising hotels is ongoing royalty fees, which are typically a percentage of gross room revenues of each franchised hotel. For a more detailed description of revenue recognition see Note 3 - Revenue Recognition.
Loyalty Program
The Company operates the Wyndham Rewards loyalty program. Loyalty members primarily accumulate points by staying in hotels operated under one of the Company’s brands. Wyndham Rewards members may also accumulate points by purchasing everyday services and products with their Wyndham Rewards co-branded credit card.
The Company earns revenue from these programs (i) when a member stays at a participating hotel or club resort or vacation rental from a fee charged by the Company to the property owner or manager, which is based upon a percentage of room revenues generated from such stay which the Company recognizes, net of redemptions, over time based upon loyalty point redemption patterns, including an estimate of loyalty points that will expire or will never be redeemed, and (ii) based upon a percentage of the member’s spending on the Wyndham Rewards co-branded credit cards for which revenues are paid to the Company by a third-party issuing bank which the Company primarily recognizes over time based upon the redemption patterns of the loyalty points earned under the program, including an estimate of loyalty points that will expire or will never be redeemed.
As members earn points through the loyalty program, the Company records a liability for the estimated future redemption costs, which is calculated based on (i) an estimated cost per point and (ii) an estimated redemption rate of the overall points earned, which is determined with the assistance of a third-party actuarial firm through historical experience, current trends and the use of an actuarial analysis. The Company estimates the value of the future redemption obligations by projecting the timing of future point redemptions based on historical levels, including an estimate of the points that will expire or never be redeemed, and an estimate of the points members will eventually redeem. The recorded liability related to the program totals $109 million and $81 million as of December 31, 2021 and 2020, respectively, of which $67 million and $43 million, respectively, are included in accrued expenses and other current liabilities, and $42 million and $38 million, respectively, are included in other non-current liabilities on the Company’s Consolidated Balance Sheets.
As a result of the negative impact that the coronavirus pandemic (“COVID-19”) had on travel demand during 2020, the Company’s assumptions related to redemptions, including estimated member redemption rate, member redemption pattern, and the estimated cost to satisfy such redemptions, changed. Accordingly, the Company recognized a $16 million cumulative adjustment, which resulted in an increase to loyalty revenues during the second quarter of 2020. Such increase was included within marketing, reservation and loyalty and other revenues on the Consolidated Statement of Income/(Loss) for the year ended December 31, 2020.
Cash and Cash Equivalents
The Company considers highly-liquid investments purchased with an original maturity of three months or less to be cash equivalents.
Valuation of Accounts Receivable
The Company measures the expected credit losses of its receivables on a collective (pool) basis which aggregates receivables with similar risk characteristics and uses historical collection attrition rates for periods ranging from seven to ten years to estimate its expected credit losses. For a more detailed description of the valuation of accounts receivable see Note 5 - Accounts Receivable.
Advertising Expense
Advertising costs are expensed in the period incurred. Advertising expenses, which are primarily recorded within marketing and reservation expenses on the Consolidated Statements of Income/(Loss), were $85 million, $57 million and $115 million in 2021, 2020 and 2019, respectively.
Property and Equipment
Property and equipment (including leasehold improvements) are recorded at cost, and presented net of accumulated depreciation and amortization. Depreciation, recorded as a component of depreciation and amortization on the Consolidated Statements of Income/(Loss), is calculated utilizing the straight-line method over the lesser of the lease terms or estimated useful lives of the related assets. Amortization of leasehold improvements, also recorded as a component of depreciation and amortization, is calculated utilizing the straight-line method over the lesser of the estimated benefit period of the related assets or the lease terms. Useful lives are generally 30 years for buildings, up to 20 years for building and leasehold improvements and from three to seven years for furniture, fixtures and equipment.
The Company capitalizes the costs of software developed for internal use in accordance with the guidance for accounting for costs of computer software developed or obtained for internal use. Capitalization of software developed for internal use commences during the development phase of the project. The Company amortizes software developed or obtained for internal use on a straight-line basis over its estimated useful life, which is generally three to five years. Such amortization commences when the software is substantially ready for its intended use.
The net carrying value of software developed or obtained for internal use was $52 million and $68 million as of December 31, 2021 and 2020, respectively.
Impairment of Long-Lived Assets
Goodwill is reviewed annually (during the fourth quarter of each year subsequent to completing the Company’s annual forecasting process), or more frequently if circumstances indicate that the value of goodwill may be impaired, to the reporting units’ carrying values as required by the guidance. This is done either by performing a qualitative assessment or utilizing the one-step impairment test, with an impairment being recognized only where the fair value is less than carrying value. In any given year, the Company can elect to perform a qualitative assessment to determine whether it is more likely than not that the fair value of a reporting unit is in excess of its carrying value. If it is not more likely than not that the fair value is in excess of the carrying value, or the Company elects to bypass the qualitative assessment, the Company would use the one-step impairment test. The qualitative factors evaluated include macroeconomic conditions, industry and market considerations, cost factors, overall financial performance, its historical share price as well as other industry-specific considerations.
The Company also determines whether the carrying values of other indefinite-lived intangible assets are impaired on an annual basis or more frequently if indicators of potential impairment exist. Application of the other indefinite-lived intangible assets impairment test requires judgment in the assumptions underlying the approach used to determine fair value. The fair value of each other indefinite-lived intangible asset is estimated using a discounted cash flow methodology. This analysis requires significant judgments, including estimation of future cash flows, which are dependent on internal forecasts, discount rates and to a lesser extent, estimation of long-term rates of growth. The estimates used to calculate the fair value of other indefinite-lived intangible assets change from year to year based on operating results and market conditions. Changes in these estimates and assumptions could materially affect the determination of fair value and the other indefinite-lived intangible assets’ impairment.
The Company also evaluates the recoverability of each of its definite-lived intangible assets by performing a qualitative assessment to determine if circumstances indicate that impairment may have occurred. If such circumstances exist, the Company performs a quantitative assessment by comparing the respective carrying value of the assets to the expected future cash flows, on an undiscounted basis, to be generated from such assets.
The Company also evaluates the recoverability of its other long-lived assets, including property and equipment, if circumstances indicate impairment may have occurred, pursuant to guidance for impairment or disposal of long-lived assets. This analysis is performed by comparing the respective carrying values of the assets to the current and expected future cash flows, on an undiscounted basis, to be generated from such assets. Property and equipment are evaluated separately within each segment. If such analysis indicates that the carrying value of these assets is not recoverable, the carrying value of such assets is reduced to fair value.
For more information on the impairment analyses performed on the Company’s goodwill, other indefinite-lived intangible assets, definite-lived intangible assets and other long-lived assets, see Note 7 - Property and Equipment, Net and Note 8 - Intangible Assets.
Business Combinations
The Company accounts for business combinations in accordance with the guidance for business combinations and related literature. Accordingly, the Company allocates the purchase price of acquired companies to the tangible and intangible assets acquired and liabilities assumed based upon their estimated fair values at the date of purchase. The difference between the purchase price and the fair value of the net assets acquired is recorded as goodwill.
In determining the fair values of assets acquired and liabilities assumed in a business combination, the Company uses various recognized valuation methods including present value modeling and referenced market values, where available. Further, the Company makes assumptions within certain valuation techniques including discount rates and timing of future cash flows. Valuations are performed by management or external valuation specialists under management’s supervision, where appropriate. The Company believes that the estimated fair values assigned to the assets acquired and liabilities assumed are based on reasonable assumptions that marketplace participants would use. However, such assumptions are inherently uncertain and actual results could differ from those estimates.
Income Taxes
The Company recognizes deferred tax assets and liabilities based on the differences between the financial statement carrying amounts and the tax basis of assets and liabilities using currently enacted tax rates. The Company regularly reviews
its deferred tax assets to assess their potential realization and establishes a valuation allowance for portions of such assets that the Company believes will not be ultimately realized. In performing this review, the Company makes estimates and assumptions regarding projected future taxable income, the expected timing of the reversals of existing temporary differences and the implementation of tax planning strategies. A change in these assumptions may increase or decrease the Company’s valuation allowance resulting in an increase or decrease in its effective tax rate, which could materially impact the Company’s results of operations.
For tax positions the Company has taken or expects to take in a tax return, it applies a more likely than not threshold, under which the Company must conclude a tax position is more likely than not to be sustained, assuming that the position will be examined by the appropriate taxing authority that has full knowledge of all relevant information, in order to recognize or continue to recognize the benefit. In determining the Company’s provision for income taxes, the Company uses judgment, reflecting its estimates and assumptions, in applying the more likely than not threshold.
In January 2018, the Financial Accounting Standards Board (“FASB”) issued guidance on the accounting for tax on the global intangible low-taxed income provisions of the recently enacted tax law. These provisions impose a tax on foreign income in excess of a deemed return on tangible assets of foreign corporations. The guidance indicates that the Company is allowed to make an accounting policy choice of either: (1) treating taxes due on future inclusions in taxable income as a current-period expense when incurred or (2) factoring such amounts into the Company’s measurement of its deferred taxes. The Company has elected to account for any inclusions under the period cost method.
Stock-Based Compensation
In accordance with the guidance for stock-based compensation, the Company measures all employee stock-based compensation awards using a fair value method and records the related expense in its Consolidated Statements of Income/(Loss).
The Company recognizes the cost of stock-based compensation awards to employees as they provide services and the expense is recognized ratably over the requisite service period. The requisite service period is the period during which an employee is required to provide services in exchange for an award. Forfeitures are recorded upon the actual employee termination for each outstanding grant.
Derivative Instruments
The Company uses derivative instruments as part of its overall strategy to manage its exposure to market risks primarily associated with fluctuations in interest rates and currency exchange rates. As a matter of policy, the Company does not use derivatives for trading or speculative purposes. All derivatives are recorded at fair value as either assets or liabilities. Changes in fair value of derivatives not designated as hedging instruments and of derivatives designated as fair value hedging instruments are recognized currently in operating income/(loss) and interest expense, net in the Consolidated Statements of Income/(Loss), based upon the nature of the hedged item. The effective portion of changes in fair value of derivatives designated as cash flow hedging instruments is recorded as a component of other comprehensive income/(loss). The ineffective portion is reported immediately in earnings as a component of operating or interest expense, based upon the nature of the hedged item. Amounts included in other comprehensive income/(loss) are reclassified into earnings in the same period during which the hedged item affects earnings.
Accumulated Other Comprehensive Income/(Loss)
Accumulated other comprehensive income (“AOCI”) (loss) consists of accumulated foreign currency translation adjustments and unrealized gains or losses on the Company’s cash flow hedges. Foreign currency translation adjustments exclude income taxes related to indefinite investments in foreign subsidiaries. Assets and liabilities of foreign subsidiaries having non-U.S.-dollar functional currencies are translated at exchange rates at the balance sheet dates. Revenues and expenses are translated at average exchange rates during the periods presented. The gains or losses resulting from translating foreign currency financial statements into U.S. dollars, net of hedging gains or losses and taxes, are included in AOCI on the Consolidated Balance Sheets.
Recently Adopted Accounting Pronouncements
Simplifying the Accounting for Income Taxes. On December 18, 2019, the FASB issued guidance which simplifies the accounting standards for income taxes. The amendment clarifies and simplifies aspects of the accounting for income taxes to help promote consistent application of GAAP by eliminating certain exceptions to the general principles of ASC 740, Income Taxes. This guidance is effective for fiscal years beginning after December 15, 2020 and interim periods within those fiscal years, with early adoption permitted. The Company adopted the guidance on January 1, 2021, as required. There was no material impact on the Company’s Consolidated Financial Statements and related disclosures as a result of adopting this new standard.
Reference Rate Reform: Facilitation of the Effects of Reference Rate Reform on Financial Reporting. In March 2020, the FASB issued optional guidance for a limited time to ease the potential burden in accounting for reference rate reform. The new guidance provides optional expedients and exceptions for applying U.S. GAAP to contracts, hedging relationships and other transactions affected by reference rate reform if certain criteria are met. The amendments apply only to contracts and hedging relationships that reference LIBOR or another reference rate expected to be discontinued due to reference rate reform. These amendments are effective immediately and may be applied prospectively to contract modifications made and hedging relationships entered into or evaluated on or before December 31, 2022. The Company adopted the guidance upon issuance, as required and there was no material impact on its Consolidated Financial Statements and related disclosures.
Measurement of Credit Losses on Financial Instruments. In June 2016, the FASB issued guidance to replace the existing methodology for estimating credit losses with a methodology that reflects lifetime expected credit losses and requires consideration of a broader range of reasonable and supportable information to inform credit loss estimates. This guidance is effective for fiscal years beginning after December 15, 2019 and interim periods within those fiscal years. The Company adopted the guidance on January 1, 2020, as required using the modified retrospective approach through a cumulative-effect adjustment to retained earnings as of the effective date to align the Company’s current processes for establishing an allowance for credit losses with the new guidance. See Note 5 - Accounts Receivable for the impact of adoption.
Simplifying the Test for Goodwill Impairment. In January 2017, the FASB issued guidance which simplifies the current two-step goodwill impairment test by eliminating Step 2 of the test. The guidance requires a one-step impairment test in which an entity compares the fair value of a reporting unit with its carrying amount and recognizes an impairment charge for the amount by which the carrying amount exceeds the reporting unit’s fair value, if any. This guidance is effective for fiscal years beginning after December 15, 2019 and interim periods within those fiscal years, and should be applied on a prospective basis. The Company adopted the guidance on January 1, 2020, as required and there was no material impact on its Consolidated Financial Statements and related disclosures.
Customer’s Accounting for Implementation Costs Incurred in a Cloud Computing Arrangement That Is a Service Contract. In August 2018, the FASB issued guidance to address a customer’s accounting for implementation costs incurred in a cloud computing arrangement that is a service contract. The guidance aligns the requirements for capitalizing implementation costs incurred in such arrangements with the requirements for capitalizing implementation costs incurred to develop or obtain internal-use software. This guidance is effective for fiscal years beginning after December 15, 2019 and for interim periods within those fiscal years. This guidance should be applied on either a retrospective or prospective basis. The Company adopted the guidance on January 1, 2020, as required on a prospective basis and there was no material impact on its Consolidated Financial Statements and related disclosures.
Leases. In February 2016, the FASB issued guidance which requires companies generally to recognize on the balance sheet operating and financing lease liabilities and corresponding right-of-use assets. This guidance is effective for fiscal years beginning after December 15, 2018 and for interim periods within those fiscal years, with early adoption permitted. The Company adopted the guidance using the modified retrospective approach as of January 1, 2019. See Note 19 - Leases for further details.
The principal source of revenues from franchising hotels is ongoing royalty fees, which are typically a percentage of gross room revenues of each franchised hotel. The Company recognizes royalty fee revenues as and when the underlying sales occur. The Company also receives non-refundable initial franchise fees, which are recognized as revenues over the initial non-cancellable period of the franchise agreement, commencing when all material services or conditions have been substantially performed. This occurs when a hotel opens for business in the Company’s system or when a franchise agreement is terminated after it has been determined that the hotel will not open.
The Company’s franchise agreements also require the payment of marketing and reservation fees, which are intended to reimburse the Company for expenses associated with operating an international, centralized reservation system, e-commerce channels such as the Company’s brand.com websites, as well as access to third-party distribution channels, such as online travel agents, advertising and marketing programs, global sales efforts, operations support, training and other related services. Marketing and reservation fees are recognized as revenue when the underlying sales occur. Although the Company is generally contractually obligated to spend the marketing and reservation fees it collects from franchisees, in accordance with the franchise agreements, marketing and reservations costs are expensed as incurred.
The Company earns revenues from its Wyndham Rewards loyalty program when a member stays at a participating hotel, club resort or vacation rental. These revenues are derived from a fee the Company charges a franchised or managed hotel based upon a percentage of room revenues generated from a Wyndham Rewards member’s stay. These fees are to reimburse the Company for expenses associated with member redemptions and activities that are related to the administering and marketing of the program. Revenues related to the loyalty program represent variable consideration and are recognized net of redemptions over time based upon loyalty point redemption patterns, which include an estimate of loyalty points that will expire or will never be redeemed.
As a result of the negative impact that COVID-19 had on travel demand in 2020, the Company’s assumptions related to redemptions, including estimated member redemption rate, member redemption pattern, and the estimated cost to satisfy such redemptions, changed. Accordingly, the Company recognized a $16 million cumulative adjustment, which resulted in an increase to loyalty revenues during the second quarter of 2020. Such increase was included within marketing, reservation and loyalty and other revenues on the Consolidated Statement of Income/(Loss) for the year ended December 31, 2020.
The Company earns revenue from its Wyndham Rewards co-branded credit card program, which is primarily generated by cardholder spending and the enrollment of new cardholders. The advance payments received under the program are recognized as a contract liability. The program primarily contains two performance obligations: (i) brand performance services, for which revenue is recognized over the contract term on a straight-line basis, and (ii) issuance and redemption of loyalty points, for which revenue is recognized over time based upon the redemption patterns of the loyalty points earned under the program, including an estimate of loyalty points that will expire or will never be redeemed.
The Company provides management services for hotels under management contracts, which offer hotel owners all the benefits of a global brand and a full range of management, marketing and reservation services. In addition to the standard franchise services described above, the Company’s hotel management business provides hotel owners with professional oversight and comprehensive operations support services. The Company’s standard management agreement typically has a term of 10 to 20 years. The Company’s management fees are comprised of base fees, which are typically a specified percentage of gross revenues from hotel operations, and, in some cases, incentive fees, which are typically a specified percentage of a hotel’s gross operating profit. The base fees are recognized when the underlying sales occur and the management services are performed. Incentive fees are recognized when determinable, which is when the Company has met hotel operating performance metrics and the Company has determined that a significant reversal of revenues recognized will not occur.
The Company also recognizes reimbursable payroll costs for operational employees and other reimbursable costs at certain of the Company’s managed hotels as revenue. Although these costs are funded by hotel owners, accounting guidance requires the Company to report these fees on a gross basis as both revenues and expenses. Additionally, the Company recognizes occupancy taxes on a net basis.
The Company recognizes license and other revenues from Wyndham Worldwide (“former Parent”), now known as Travel + Leisure Co., for use of the “Wyndham” trademark and certain other trademarks.
In addition, the Company earns revenues from its two owned hotels, which consist primarily of (i) gross room rentals, (ii) food and beverage services and (iii) on-site spa, casino, golf and shop revenues. These revenues are recognized upon the completion of services.
Deferred Revenues
Deferred revenues, or contract liabilities, generally represent payments or consideration received in advance for goods or services that the Company has not yet provided to the customer. Deferred revenues as of December 31, 2021 and December 31, 2020 are as follows:
| | | | | | | | | | | |
| December 31, 2021 | | December 31, 2020 |
Deferred initial franchise fee revenues | $ | 145 | | | $ | 136 | |
Deferred loyalty program revenues | 76 | | | 75 | |
| | | |
Deferred other revenues | 14 | | | 18 | |
Total | $ | 235 | | | $ | 229 | |
Deferred initial franchise fees represent payments received in advance from prospective franchisees upon the signing of a franchise agreement and are generally recognized to revenue within 13 years. Deferred loyalty revenues represent the portion of loyalty program fees charged to franchisees, net of redemption costs, that have been deferred and will be recognized over time based upon loyalty point redemption patterns.
Practical Expedients
The Company has not adjusted the consideration for the effects of a significant financing component if it expects, at contract inception, that the period between when the Company satisfied the performance obligation and when the customer paid for that good or service was one year or less.
For contracts with customers that were modified before the beginning of the earliest reporting period presented, the Company did not retrospectively restate the revenue associated with the contract for those modifications. Instead, it reflected the aggregate effect of all prior modifications in determining (i) the performance obligations and transaction prices and (ii) the allocation of such transaction prices to the performance obligations.
Performance Obligations
A performance obligation is a promise in a contract to transfer a distinct good or service to a customer. The consideration received from a customer is allocated to each distinct performance obligation and recognized as revenue when, or as, each performance obligation is satisfied. The following table summarizes the Company’s remaining performance obligations for the years set forth below:
| | | | | | | | | | | | | | | | | | | | | | | | | | | | | |
| 2022 | | 2023 | | 2024 | | Thereafter | | Total |
Initial franchise fee revenues | $ | 16 | | | $ | 8 | | | $ | 7 | | | $ | 114 | | | $ | 145 | |
Loyalty program revenues | 47 | | | 20 | | | 7 | | | 2 | | | 76 | |
| | | | | | | | | |
Other revenues | 7 | | | 1 | | | 1 | | | 5 | | | 14 | |
Total | $ | 70 | | | $ | 29 | | | $ | 15 | | | $ | 121 | | | $ | 235 | |
Disaggregation of Net Revenues
The table below presents a disaggregation of the Company’s net revenues from contracts with customers by major services and products for each of the Company’s segments:
| | | | | | | | | | | | | | | | | |
| Year Ended December 31, |
| 2021 | | 2020 | | 2019 |
Hotel Franchising | | | | | |
Royalties and franchise fees | $ | 436 | | | $ | 309 | | | $ | 465 | |
Marketing, reservation and loyalty | 467 | | | 369 | | | 559 | |
License and other fees | 79 | | | 84 | | | 131 | |
Other | 117 | | | 101 | | | 124 | |
Total Hotel Franchising | 1,099 | | | 863 | | | 1,279 | |
| | | | | |
Hotel Management | | | | | |
Royalties and franchise fees | 25 | | | 19 | | | 15 | |
Marketing, reservation and loyalty | 1 | | | 1 | | | 3 | |
Owned hotel revenues | 82 | | | 37 | | | 89 | |
Management fees (a) | 35 | | | 27 | | | 36 | |
Cost reimbursements | 320 | | | 350 | | | 623 | |
Other | 3 | | | 3 | | | 2 | |
Total Hotel Management | 466 | | | 437 | | | 768 | |
| | | | | |
Corporate and Other | — | | | — | | | 6 | |
| | | | | |
Net revenues | $ | 1,565 | | | $ | 1,300 | | | $ | 2,053 | |
_____________________
(a) 2019 includes a $20 million fee credit for past services with a customer. See Note 17 - Other Expenses and Charges for more information.
Capitalized Contract Costs
The Company incurs certain direct and incremental sales commissions costs in order to obtain hotel franchise and management contracts. Such costs are capitalized and subsequently amortized beginning upon hotel opening over the first non-cancellable period of the agreement. In the event an agreement is terminated prior to the end of the first non-cancellable period, any unamortized cost is immediately expensed. In addition, the Company also capitalizes costs associated with the sale and installation of property management systems to its franchisees, which are amortized over the remaining non-cancellable period of the franchise agreement. As of both December 31, 2021 and December 31, 2020, capitalized contract costs were $33 million, of which $5 million and $7 million, respectively, were included in other current assets, and $28 million and $26 million, respectively, were included in other non-current assets on the Company’s Consolidated Balance Sheets.
The computation of basic and diluted earnings/(loss) per share (“EPS”) is based on net income/(loss) divided by the basic weighted average number of common shares and diluted weighted average number of common shares, respectively.
The following table sets forth the computation of basic and diluted EPS (in millions, except per-share data) for the years ended December 31:
| | | | | | | | | | | | | | | | | |
| 2021 | | 2020 | | 2019 |
| Net income/(loss) | $ | 244 | | | $ | (132) | | | $ | 157 | |
| | | | | |
Basic weighted average shares outstanding | 93.4 | | | 93.4 | | | 96.5 | |
Stock options and restricted stock units (“RSUs”) (a) | 0.5 | | | — | | | 0.1 | |
Diluted weighted average shares outstanding | 93.9 | | | 93.4 | | | 96.6 | |
| | | | | |
Earnings/(loss) per share: | | | | | |
Basic | $ | 2.61 | | | $ | (1.42) | | | $ | 1.63 | |
Diluted | 2.60 | | | (1.42) | | | 1.62 | |
| | | | | |
Dividends: | | | | | |
Cash dividends declared per share | $ | 0.88 | | | $ | 0.56 | | | $ | 1.16 | |
Aggregate dividends paid to stockholders | $ | 82 | | | $ | 53 | | | $ | 112 | |
_____________________
(a) Due to the anti-dilutive effect resulting from the reported net loss for the year ended December 31, 2020, 0.1 million of anti-dilutive shares were omitted from the calculation of weighted average shares outstanding for the period.
Stock Repurchase Program
The following table summarizes stock repurchase activity under the current stock repurchase program (in millions, except per share data):
| | | | | | | | | | | | | | | | | |
| Shares | | Cost | | Average Price Per Share |
As of January 1, 2020 | 7.7 | | | $ | 408 | | | $ | 53.43 | |
For the twelve months ended December 31, 2021 | 1.4 | | | 110 | | | 80.60 | |
| As of December 31, 2021 | 9.0 | | | $ | 519 | | | $ | 57.55 | |
_____________________Note: Amounts may not add due to rounding.
The Company had $81 million of remaining availability under its program as of December 31, 2021.
Allowance for Doubtful Accounts
The Company generates trade receivables in the ordinary course of its business and provides for estimated bad debts on such receivables. The Company adopted the new accounting guidance, ASU 2016-13, Measurement of Credit Losses on Financial Instruments on January 1, 2020. As a result of adopting the new guidance, the Company recorded a $10 million (net of a $2 million income tax benefit) cumulative effect adjustment to retained earnings at January 1, 2020. Since adoption, the Company measures the expected credit losses of its receivables on a collective (pool) basis which aggregates receivables with similar risk characteristics and uses historical collection attrition rates for periods ranging from seven to ten years to estimate its expected credit losses. As such, the Company measures the expected credit losses of its receivables by segment and geographical area. Beginning January 1, 2020, the Company provides an estimate of expected credit losses for its receivables immediately upon origination or acquisition and may adjust this estimate in subsequent reporting periods as required. When the Company determines that an account is not collectible, the account is written-off to the allowance for doubtful accounts. The Company also considers whether the historical economic conditions are comparable to current economic conditions. If current or expected future conditions differ from the conditions in effect when the historical experience was generated, the Company would adjust the allowance for doubtful accounts to reflect the expected effects of the current environment on the collectability of the Company’s trade receivables which may be material.
The following table sets forth the activity in the Company’s allowance for doubtful accounts on trade accounts receivables for the years ended:
| | | | | | | | | | | | | | | | | |
| December 31, 2021 | | December 31, 2020 | | December 31, 2019 |
| Beginning balance | $ | 72 | | $ | 47 | | $ | 52 |
| Cumulative effect of change in accounting standard | — | | 12 | | — |
| Provision for doubtful accounts | 21 | | 37 | | 16 |
| Bad debt write-offs | (12) | | (24) | | (21) |
| Ending balance | $ | 81 | | $ | 72 | | $ | 47 |
The Consolidated Statements of Cash Flows have been revised to separately disclose the provision for doubtful accounts of $16 million for the year ended December 31, 2019. This revision had no effect on the Company’s net cash provided by operating activities, as previously reported for the year ended December 31, 2019.
Notes Receivable
As of December 31, 2021 and 2020, the Company had notes receivable of $4 million and $9 million, respectively, net of a $3 million and $4 million allowance, respectively. For a significant portion of such notes receivable, the Company has received personal guarantees from the owners of these hotels. In addition, the Company had $20 million and $18 million of notes receivable as of December 31, 2021 and 2020, respectively, which are fully offset by a corresponding amount in deferred revenues.
| | |
| 6. ASSETS AND LIABILITIES HELD FOR SALE |
During the fourth quarter of 2021, the Company’s Board approved a plan to sell its two owned hotels. As of December 31, 2021, the assets and liabilities of these owned hotels were reported in assets held for sale and liabilities held for sale on the Consolidated Balance Sheet. As a result of the Board approval, the Company evaluated the recoverability of its owned hotels’ long-lived assets by comparing their carrying values to the fair value determined using market data. As a result of this analysis, in the fourth quarter of 2021, the Company recorded a $6 million impairment charge within its hotel management segment which was reported within impairments, net on the Consolidated Statement of Income/(Loss).
The Company’s Consolidated Balance Sheet includes the following with respect to assets and liabilities held for sale as of December 31, 2021:
| | | | | |
Assets: | |
Trade receivables, net | $ | 4 | |
| Other current assets | 4 | |
| Property and equipment, net | 146 | |
| Total assets held for sale | $ | 154 | |
| |
| Liabilities: | |
| Accrued expenses and other current liabilities | $ | 8 | |
| Deferred revenues | 6 | |
| Other liabilities | 3 | |
| Total liabilities held for sale | $ | 17 | |
| | |
| 7. PROPERTY AND EQUIPMENT, NET |
During the fourth quarter of 2021, the Company’s Board approved a plan to sell its two owned hotels. As a result of the Board approval, the Company evaluated the recoverability of its owned hotels’ long-lived assets and in the fourth quarter of 2021, the Company recorded a $6 million impairment charge which was reported within impairments, net on the Consolidated Statement of Income/(Loss). Due to the ongoing recovery of travel demand in 2021 and the favorable impact it had on the Company’s operations, the Company believes there were no other events that would indicate that an impairment to such property and equipment may have occurred in 2021. As a result of the impact COVID-19 had on the Company’s results during 2020, the Company evaluated the recoverability of its net property and equipment associated with its two owned hotels for impairment in 2020 and believed that it was more likely than not that the carrying value of those assets were recoverable from future expected cash flows, on an undiscounted basis, from such assets.
Property and equipment, net consisted of:
| | | | | | | | | | | |
| As of December 31, |
| 2021 | | 2020 |
| Land | $ | — | | | $ | 19 | |
| Buildings and leasehold improvements | 30 | | | 215 | |
| Capitalized software | 326 | | | 353 | |
| Furniture, fixtures and equipment | 32 | | | 85 | |
| Finance leases | 64 | | | 65 | |
| Construction in progress | 12 | | | 3 | |
| 464 | | | 740 | |
| Less: Accumulated depreciation | 358 | | | 462 | |
| $ | 106 | | | $ | 278 | |
As of December 31, 2021 the Company reported $146 million of net property and equipment in assets held for sale on the Consolidated Balance Sheets.
The Company recorded depreciation expense of $57 million, $61 million, and $71 million during 2021, 2020 and 2019, respectively, related to property and equipment.
Goodwill
The Company evaluates the carrying value of its goodwill in each of its reporting units (i) hotel franchising, (ii) hotel management and (iii) owned hotels, compared to their respective estimated fair values on an annual basis during the fourth quarter of every year, or more frequently if circumstances indicate that the fair value of goodwill may be impaired, to the reporting units’ carrying values as required by guidance. As a result of the impact COVID-19 had on the Company’s results during 2020, the Company performed multiple qualitative assessments on its goodwill throughout 2020, a quantitative assessment in the second quarter of 2020 and its annual quantitative assessment as of October 1, 2020. With the exception of the assessment performed in the second quarter of 2020, the Company determined that it was more likely than not that the fair value of its reporting units continued to substantially exceed their carrying values. In connection with the Company’s assessment in the second quarter of 2020, the Company incurred a $14 million charge in the second quarter of 2020 to fully write-down the goodwill balance for its owned hotel reporting unit. Such charge was reported within impairments, net on the Consolidated Statement of Income/(Loss) and was charged to the hotel management segment.
The Company believes there were no events that would indicate that an impairment may have occurred to its goodwill for its hotel franchising or hotel management reporting units during 2021. In addition the Company performed its annual quantitative assessment for impairment on each reporting unit’s remaining goodwill as of October 1, 2021 and determined that no impairments existed and that it was more likely than not that the fair value of its reporting units continued to substantially exceed their carrying values.
Other Intangibles
As a result of the impact COVID-19 had on the Company’s results, during 2020 the Company performed multiple assessments on the carrying value of each of its other indefinite-lived intangible assets compared to their respective estimated
fair values in addition to its annual assessment as of October 1, 2020. With the exception of the assessment performed in the second quarter of 2020, the Company determined that it was more likely than not that the fair value of its other indefinite-lived intangible assets continued to substantially exceed their carrying values. During the second quarter of 2020, the Company determined through such assessment that certain of its trademarks were impaired. Accordingly, the Company recorded impairment charges of $191 million to reduce the carrying value of those trademarks to their estimated fair values. Such charges were reported within impairments, net on the Consolidated Statement of Income/(Loss) and were charged to the hotel franchising segment. The Company performed its annual impairment assessment of its other indefinite-lived intangible assets as of October 1, 2021 and determined that no impairments exist. In addition, the Company believes there were no events that would indicate an impairment may have occurred to its indefinite-lived intangible assets during 2021.
The Company also evaluates the recoverability of each of its definite-lived intangible assets by performing a qualitative assessment to determine if circumstances indicate that impairment may have occurred. If such circumstances exist, the Company performs a quantitative assessment by comparing the respective carrying value of the assets to the expected future cash flows, on an undiscounted basis, to be generated from such assets. During 2020, the Company performed multiple assessments on the recoverability of each of its definite-lived intangible assets to determine if circumstances indicated that impairment may have occurred and determined through such assessments, that it was more likely than not that the future expected cash flows on an undiscounted basis were in excess of the carrying value of such assets. In addition, the Company performed a quantitative impairment assessment for a management contract and certain franchise agreements during the fourth quarter of 2021 and 2020. As a result of these assessments, the Company determined these assets were not impaired. The Company believes there were no other events that would indicate that an impairment may have occurred to its definite-lived intangible assets during 2021.
The Company does not anticipate the pandemic to further materially impact the results from operations, however should there be a resurgence of the virus which results in new government restrictions and slows the ongoing recovery from the effects of the pandemic, the Company’s results of operations may be negatively impacted and its intangible assets within its hotel franchising and hotel management reporting units may be exposed to future impairments. To the extent estimated market-based valuation multiples and/or discounted cash flows are revised downward, the Company may be required to write-down all or a portion of its remaining goodwill, trademarks, franchise agreements and management contracts, which would adversely impact earnings.
The following is the breakout of the intangible impairment charges recorded in the second quarter of 2020:
| | | | | | | | | | | | | | | | | | | | |
| Intangible Asset | | Book Value | | Impairment Charges | | Adjusted Fair Value |
| Owned hotel reporting unit goodwill | | $ | 14 | | | $ | (14) | | | $ | — | |
| La Quinta trademark | | 710 | | | (155) | | | 555 | |
Other trademarks (a) | | 103 | | | (36) | | | 67 | |
| Total | | $ | 827 | | | $ | (205) | | | $ | 622 | |
_____________________
(a) Represents the impairments of three of the Company’s trademarks.
Intangible assets as of December 31, 2021 and December 31, 2020 consisted of the following:
| | | | | | | | | | | | | | | | | | | | | | | | | | | | | | | | | | | |
| December 31, 2021 | | December 31, 2020 |
| Gross
Carrying
Amount | | Accumulated
Impairment | | Net
Carrying
Amount | | Gross
Carrying
Amount | | Accumulated
Impairment | | Net
Carrying
Amount |
| Goodwill | $ | 1,539 | | | $ | 14 | | | $ | 1,525 | | | $ | 1,539 | | | $ | 14 | | | $ | 1,525 | |
| | | | | | | | | | | |
| December 31, 2021 | | December 31, 2020 |
| Gross
Carrying
Amount | | Accumulated
Amortization | | Net
Carrying
Amount | | Gross
Carrying
Amount | | Accumulated
Amortization | | Net
Carrying
Amount |
| Unamortized intangible assets: | | | | | | | | | | | |
Trademarks | | | | | $ | 1,201 | | | | | | | $ | 1,202 | |
| | | | | | | | | | | |
| Amortized intangible assets: | | | | | | | | | | | |
| Franchise agreements | $ | 895 | | | $ | 513 | | | $ | 382 | | | $ | 895 | | | $ | 487 | | | $ | 408 | |
| Management agreements | 135 | | | 44 | | | 91 | | | 136 | | | 33 | | | 103 | |
| Trademarks | 2 | | | 1 | | | 1 | | | 2 | | | 1 | | | 1 | |
Other | 1 | | | 1 | | | — | | | 1 | | | — | | | 1 | |
| $ | 1,033 | | | $ | 559 | | | $ | 474 | | | $ | 1,034 | | | $ | 521 | | | $ | 513 | |
The changes in the carrying amount of goodwill are as follows:
| | | | | | | | | | | | | | | | | |
| Balance as of January 1, 2020 | | 2020 Adjustments to Goodwill (a) | | Balance as of December 31, 2021 |
| Hotel Franchising | $ | 1,441 | | | $ | — | | | $ | 1,441 | |
| Hotel Management | 98 | | | (14) | | | 84 | |
| Total | $ | 1,539 | | | $ | (14) | | | $ | 1,525 | |
______________________
(a) Includes $14 million related to an impairment charge associated with the Company’s owned hotel reporting unit.
Amortization expense relating to amortizable intangible assets was as follows for the years ended December 31:
| | | | | | | | | | | | | | | | | |
| 2021 | | 2020 | | 2019 |
Franchise agreements | $ | 27 | | | $ | 27 | | | $ | 27 | |
Management agreements | 11 | | | 10 | | | 10 | |
| | | | | |
Other | — | | | — | | | 1 | |
Total (a) | $ | 38 | | | $ | 37 | | | $ | 38 | |
______________________
(a) Included as a component of depreciation and amortization on the Consolidated Statements of Income/(Loss).
Based on the Company’s amortizable intangible assets as of December 31, 2021, the Company expects related amortization expense as follows:
| | | | | |
| Amount |
| 2022 | $ | 32 | |
| 2023 | 27 | |
| 2024 | 26 | |
| 2025 | 26 | |
| 2026 | 25 | |
| | |
| 9. FRANCHISING, MARKETING AND RESERVATION ACTIVITIES |
Royalties and franchise fee revenues on the Consolidated Statements of Income/(Loss) include initial franchise fees of $14 million, $20 million and $18 million in 2021, 2020 and 2019, respectively.
In accordance with its franchise agreements, the Company is generally contractually obligated to expend the marketing and reservation fees it collects from franchisees for the operation of an international, centralized, brand-specific reservation system and for marketing purposes such as advertising, promotional and co-marketing programs, and training for the respective franchisees.
Development Advance Notes
The Company may, at its discretion, provide development advance notes to certain franchisees or hotel owners in order to assist them in converting to one of its’ brands, in building a new hotel to be flagged under one of its’ brands or in assisting in other franchisee expansion efforts. Provided the franchisee/hotel owner is in compliance with the terms of the franchise/management agreement, all or a portion of the development advance notes may be forgiven by the Company over the period of the franchise/management agreement, which typically ranges from 10 to 20 years. Otherwise, the related principal is due and payable to the Company. In certain instances, the Company may earn interest on unpaid franchisee development advance notes.
As a result of COVID-19 and the significant negative impact it had on travel demand in 2020, the Company performed a quantitative assessment on its development advance notes and determined that it was more likely than not that the carrying value of those assets were recoverable from future expected cash flows as of December 31, 2020. Due to the ongoing recovery of travel demand in 2021 and the favorable impact it had on the Company’s operations, the Company believes there were no events that would indicate that an impairment to such development advance notes may have occurred in 2021.
The Company’s Consolidated Financial Statements include the following with respect to development advances:
| | | | | | | | | | | |
Consolidated Balance Sheets: | As of December 31, |
| 2021 | | 2020 |
Other non-current assets | $ | 108 | | | $ | 92 | |
| | | | | | | | | | | | | | | | | |
Consolidated Statements of Income/(Loss): | Year Ended December 31, |
| 2021 | | 2020 | | 2019 |
Forgiveness of notes (a) | $ | 11 | | | $ | 9 | | | $ | 8 | |
| Bad debt expense related to notes | 1 | | | 1 | | | 2 | |
| Interest earned on unpaid notes | — | | | — | | | 1 | |
_____________________
(a) Amounts are recorded as a reduction of royalties and franchise fees and marketing, reservation and loyalty revenues.
| | |
| 10. ACCRUED EXPENSES AND OTHER CURRENT LIABILITIES |
Accrued expenses and other current liabilities consisted of:
| | | | | | | | | | | |
| As of December 31, |
| 2021 | | 2020 |
| Accrued payroll and related expenses | $ | 74 | | | $ | 53 | |
| Accrued loyalty program liabilities (Note 2) | 67 | | | 43 | |
| Accrued taxes payable | 33 | | | 29 | |
| Accrued self-insurance liabilities | 25 | | | 38 | |
| Accrued marketing expenses | 11 | | | 6 | |
| Accrued interest | 9 | | | 15 | |
| Accrued professional expenses | 9 | | | 7 | |
| Accrued legal settlements (Note 14) | 6 | | | 4 | |
| Due to former Parent (Note 18) | 5 | | | 3 | |
| Operating lease liabilities (Note 19) | 4 | | | 4 | |
| | | |
| | | |
| Accrued restructuring (Note 17) | — | | | 10 | |
| Other | 15 | | | 14 | |
| $ | 258 | | | $ | 226 | |
The income tax provision/(benefit) consists of the following:
| | | | | | | | | | | | | | | | | | | | |
| | Year Ended December 31, |
| | 2021 | | 2020 | | 2019 |
| Current | | | | | |
| Federal | $ | 65 | | | $ | (5) | | | $ | 40 | |
| State | 16 | | | (2) | | | 3 | |
| Foreign | 11 | | | 4 | | | 21 | |
| | 92 | | | (3) | | | 64 | |
| Deferred | | | | | |
| Federal | (5) | | | (10) | | | (3) | |
| State | — | | | (8) | | | (10) | |
| Foreign | 4 | | | (5) | | | (1) | |
| | (1) | | | (23) | | | (14) | |
| (Benefit from)/provision for income taxes | $ | 91 | | | $ | (26) | | | $ | 50 | |
Pretax income/(loss) for domestic and foreign operations consisted of the following:
| | | | | | | | | | | | | | | | | |
| Year Ended December 31, |
| 2021 | | 2020 | | 2019 |
| Domestic | $ | 312 | | | $ | (113) | | | $ | 175 | |
| Foreign | 23 | | | (45) | | | 32 | |
| Pretax (loss)/income | $ | 335 | | | $ | (158) | | | $ | 207 | |
Deferred Taxes
Deferred income tax assets and liabilities are comprised of the following:
| | | | | | | | | | | | | | |
| | As of December 31, |
| | 2021 | | 2020 |
| Deferred income tax assets: | | | |
| Accrued liabilities and deferred revenues | $ | 77 | | | $ | 74 | |
| Tax credits (a) | 7 | | | 8 | |
| Provision for doubtful accounts | 10 | | | 9 | |
| Net operating loss carryforward (b) | 21 | | | 25 | |
| Other comprehensive income and other | 14 | | | 22 | |
| Valuation allowance (c) | (27) | | | (26) | |
| Deferred income tax assets | 102 | | | 112 | |
| | | | |
| Deferred income tax liabilities: | | | |
| Depreciation and amortization | 444 | | | 446 | |
| Other | 19 | | | 16 | |
| Deferred income tax liabilities | 463 | | | 462 | |
| Net deferred income tax liabilities | $ | 361 | | | $ | 350 | |
| | | | |
| Reported in: | | | |
| Other non-current assets | $ | 5 | | | $ | 9 | |
| Deferred income taxes | 366 | | | 359 | |
| Net deferred income tax liabilities | $ | 361 | | | $ | 350 | |
_____________________
(a) As of December 31, 2021, the Company had $7 million of foreign tax credits. The foreign tax credits expire no later than 2031.
(b) As of December 31, 2021, the Company’s net operating loss carryforwards primarily relate to state net operating losses, which are due to expire at various dates, but no later than 2041.
(c) The valuation allowance of $27 million at December 31, 2021 relates to net operating loss carryforwards, certain deferred tax assets and foreign tax credits of $17 million, $6 million and $4 million, respectively. The valuation allowance of $26 million at December 31, 2020 relates to net operating loss carryforwards, certain deferred tax assets and foreign tax credits of $16 million, $3 million and $7 million, respectively. The valuation allowance will be reduced when and if the Company determines it is more likely than not that the related deferred income tax assets will be realized.
Although the one-time mandatory deemed repatriation tax during 2017 and the territorial tax system created as a result of U.S. tax reform generally eliminate U.S. federal income taxes on dividends from foreign subsidiaries, the Company continues to assert that all of the undistributed foreign earnings of $24 million will be reinvested indefinitely as of December 31, 2021. In the event the Company determines not to continue to assert that all or part of its undistributed foreign earnings are permanently reinvested, such a determination in the future could result in the accrual and payment of additional foreign withholding taxes and U.S. taxes on currency transaction gains and losses, the determination of which is not practicable due to the complexities associated with the hypothetical calculation.
The Company’s effective income tax rate differs from the U.S. federal statutory rate as follows for the years ended December 31:
| | | | | | | | | | | | | | | | | |
| 2021 | | 2020 | | 2019 |
| Federal statutory rate | 21.0 | % | | 21.0 | % | | 21.0 | % |
| State and local income taxes, net of federal tax benefits | 3.1 | | | 5.5 | | | (3.8) | |
| Taxes on foreign operations at rates different than U.S. federal statutory rates | 2.0 | | | (2.1) | | | 5.0 | |
| Taxes on foreign income, net of tax credits | 0.3 | | | 1.2 | | | (0.5) | |
| Nondeductible executive compensation | 0.7 | | | (1.9) | | | 1.1 | |
| Nondeductible goodwill impairment | — | | | (1.8) | | | — | |
| Valuation allowances | 0.5 | | | (5.2) | | | 1.9 | |
| Other | (0.4) | | | (0.2) | | | (0.5) | |
| 27.2 | % | | 16.5 | % | | 24.2 | % |
The effective income tax rate for 2021, 2020 and 2019 differs from the U.S. Federal income tax rate of 21% primarily due to state taxes and U.S. and foreign taxes, including withholding taxes on the Company’s international operations. During 2020, our effective tax rate was lower primarily related to goodwill impairment charges that are nondeductible for tax purposes and valuation allowances for certain deferred tax attributes. During 2019, the tax effect was partially offset by a one-time state tax benefit resulting from a settlement with state taxing authorities and from a change in the Company’s state income tax filing position due to its spin-off from former Parent.
The following table summarizes the activity related to the Company’s unrecognized tax benefits as of December 31:
| | | | | | | | | | | | | | | | | |
| 2021 | | 2020 | | 2019 |
| Beginning balance | $ | 9 | | | $ | 11 | | | $ | 13 | |
| Increases related to tax positions taken during a prior period | 1 | | | — | | | 2 | |
| Increases related to tax positions taken during the current period | — | | | 1 | | | — | |
| Decreases related to settlements with taxing authorities | — | | | — | | | (3) | |
| Decreases as a result of a lapse of the applicable statute of limitations | (2) | | | (3) | | | (1) | |
| Decreases related to tax positions taken during a prior period | (1) | | | — | | | — | |
| Ending balance | $ | 7 | | | $ | 9 | | | $ | 11 | |
The gross amount of the unrecognized tax benefits that, if recognized, would affect the Company’s effective tax rate was $7 million, $9 million and $11 million as of December 31, 2021, 2020 and 2019, respectively. The Company recorded both accrued interest and penalties related to unrecognized tax benefits as a component of provision for/(benefit from) income taxes on the Consolidated Statements of Income/(Loss). The amount of potential penalties and interest related to these unrecognized tax benefits recorded in the provision for income taxes was immaterial during 2021 and a benefit of $1 million during both 2020 and 2019. The Company had a liability for potential penalties of $1 million as of December 31, 2021 and 2020, and $2 million as of December 31, 2019 and potential interest of $2 million, as of December 31, 2021, 2020 and 2019. Such liabilities are reported as a component of accrued expenses and other current liabilities and other non-current liabilities on the Consolidated Balance Sheets. The Company does not expect the unrecognized tax benefits to change significantly over the next 12 months.
On May 30, 2018 the Company completed its acquisition of La Quinta Holdings, Inc.’s (“LQ”) hotel franchising and hotel management business. LQ, and then affiliated entities in existence prior to their acquisition by the Company, were under audit by the Internal Revenue Service (“IRS”) for tax years ended December 31, 2010 to December 31, 2016. As part of the LQ acquisition, CorePoint Lodging, Inc. (“CorePoint”) has agreed to indemnify the Company for any obligations and expenses arising from any adjustments made in connection with tax years 2010 to 2013 IRS audits, including any amounts owed by LQ with respect to subsequent taxable years as a result of the disallowance of net operating losses or other tax attributes and any legal defense and accounting expenses that arise. On November 29, 2021, CorePoint and the IRS entered into a settlement agreement for tax years 2010 to 2013 relating to entities that remain with CorePoint. The agreed-upon adjustments to the 2010 to 2013 tax returns filed for these CorePoint entities are therefore not expected to impact the Company. The Company has not recorded a liability for tax, penalty, or interest related to this settlement because such settlement relates to entities that remain with CorePoint and accordingly CorePoint is responsible for payment of these amounts for the audit years being adjusted. Subsequent to December 31, 2021, the Company received a letter from the IRS that states they completed their review of the examination of the Company's tax returns. As a result, there are no changes to the Company's reported tax for tax years up through 2016.
The Company files income tax returns in the U.S. federal and state jurisdictions, as well as in foreign jurisdictions. Prior to its spin-off, the Company was part of a consolidated U.S. federal income tax return and consolidated state returns with its former Parent and other subsidiaries that are not included in its Consolidated Financial Statements. Income taxes as presented in the Company’s Consolidated Financial Statements prior to its spin-off presented current and deferred income taxes of the consolidated federal tax filing attributed to the Company using the separate return method. The separate return method applies the accounting guidance for income taxes to the financial statements as if the Company was a separate taxpayer. The 2015 through 2021 tax years generally remain subject to examination by federal tax authorities, the years 2015 through pre-spin off 2018 tax years as part of the Company’s former Parent filing. The 2015 through 2021 tax years generally remain subject to examination by many state tax authorities. In significant foreign jurisdictions, the 2014 through the 2021 tax years generally remain subject to examination by their respective tax authorities. The statute of limitations is scheduled to expire within 12 months of the reporting date in certain taxing jurisdictions, and the Company therefore believes that it is reasonably possible that the total amount of its unrecognized tax benefits could decrease by $4 million to $5 million.
The Company made cash income tax payments, net of refunds, of $114 million during 2021. The Company received income tax refunds, net of payments, of $9 million and made cash income tax payments, net of refunds, of $59 million during 2020 and 2019, respectively. The 2019 payments exclude $195 million of tax payments related to assumed liabilities in connection with the La Quinta acquisition. Additionally, the Company had $48 million and $24 million of income tax receivables as of December 31, 2021 and 2020, respectively, which was reported on other current assets on the Consolidated Balance Sheets.
| | |
| 12. LONG-TERM DEBT AND BORROWING ARRANGEMENTS |
The Company’s indebtedness consisted of:
| | | | | | | | | | | | | | | | | | | | | | | |
| As of December 31, |
| 2021 | | 2020 |
Long-term debt: (a) | Amount | | Weighted Average Rate (b) | | Amount | | Weighted Average Rate (b) |
| $750 million revolving credit facility (due May 2023) | $ | — | | | | | $ | — | | | |
| Term loan (due May 2025) | 1,541 | | | 3.07% | | 1,554 | | | 3.18% |
| 5.375% senior unsecured notes (due April 2026) | — | | | | | 496 | | | 5.38% |
| 4.375% senior unsecured notes (due August 2028) | 493 | | | 4.38% | | 492 | | | 4.38% |
| Finance leases | 50 | | | 4.50% | | 55 | | | 4.50% |
| Total long-term debt | 2,084 | | | | | 2,597 | | | |
| Less: Current portion of long-term debt | 21 | | | | | 21 | | | |
| Long-term debt | $ | 2,063 | | | | | $ | 2,576 | | | |
_____________________
(a) The carrying amount of the term loan and senior unsecured notes are net of deferred debt issuance costs of $15 million and $22 million as of December 31, 2021 and 2020, respectively.
(b) Weighted average interest rate based on year-end balances, including the effects from hedging.
Maturities and Capacity
The Company’s outstanding debt as of December 31, 2021 matures as follows:
| | | | | |
| Long-Term Debt |
| Within 1 year | $ | 21 | |
| Between 1 and 2 years | 21 | |
| Between 2 and 3 years | 22 | |
| Between 3 and 4 years | 1,499 | |
| Between 4 and 5 years | 7 | |
| Thereafter | 514 | |
| Total | $ | 2,084 | |
As of December 31, 2021, the available capacity under the Company’s revolving credit facility was as follows:
| | | | | |
| Revolving Credit Facility |
| Total capacity | $ | 750 | |
| Less: Letters of credit | 15 | |
| Available capacity | $ | 735 | |
Long-Term Debt
$750 million Revolving Credit Facility
During May 2018, the Company entered into an agreement for a $750 million revolving credit facility expiring in May 2023. This facility is subject to an interest rate per annum equal to, at the Company’s option, either a base rate plus a margin ranging from 0.50% to 1.00% or LIBOR plus a margin ranging from 1.50% to 2.00%, in either case based upon the total leverage ratio of the Company and its restricted subsidiaries. In addition, the Company will pay a commitment fee on the unused portion of the revolving credit facility of 0.20% per annum.
In April 2020, the Company completed an amendment to its revolving credit facility agreement to waive the quarterly-tested leverage covenant until April 1, 2021. The covenant was also modified for the second, third and fourth quarters of 2021 to use a form of annualized EBITDA, as defined in the credit agreement, rather than the last twelve months EBITDA, as previously required. In return for this modification, the Company agreed to temporarily maintain minimum liquidity of $200 million, which is defined in the credit agreement as the total of unrestricted cash on hand and available capacity under the Company’s revolving credit facility, pay a higher interest rate on outstanding borrowings, restrict share repurchases and reduce payment of dividends, or restrict dividends to $0.01 per share in the event the Company’s liquidity was below $300 million. As of December 31, 2021 all restrictions have been lifted.
$1.6 billion Term Loan Agreement
During May 2018, the Company entered a credit agreement for a $1.6 billion term loan (the “Term Loan”) expiring in May 2025. The interest rate per annum applicable to the Term Loan is equal to, at the Company’s option, either a base rate plus a margin of 0.75% or LIBOR plus a margin of 1.75%. The LIBOR rate with respect to the Term Loan is subject to a “floor” of 0.00%. The Term Loan began amortizing in equal quarterly installments beginning in the fourth quarter of 2018 in aggregate annual amounts equal to 1.00% of the original principal amount thereof. The Term Loan is subject to standard mandatory prepayment provisions including (i) 100% of the net cash proceeds from issuances or incurrence of debt by the Company or any of its restricted subsidiaries (other than with respect to certain permitted indebtedness); (ii) 100% (with step-downs to 50% and 0% based upon achievement of specified first-lien leverage ratios) of the net cash proceeds from certain sales or other dispositions of assets by the Company or any of its restricted subsidiaries in excess of a certain amount and subject to customary reinvestment provisions and certain other exceptions; and (iii) 50% (with step-downs to 25% and 0% based upon achievement of specified first-lien leverage ratios) of annual (commencing with the 2019 fiscal year) excess cash flow of the Company and its restricted subsidiaries, subject to customary exceptions and limitations.
The revolving credit facility and term loan (the “Credit Facilities”) are guaranteed, jointly and severally, by certain of the Company’s wholly-owned domestic subsidiaries and secured by a first-priority security interest in substantially all of the assets of the Company and those subsidiaries. The Credit Facilities were initially guaranteed by former Parent, which guarantee was released immediately prior to the consummation of the spin-off. The Credit Facilities contain customary covenants that, among other things, restrict, subject to certain exceptions, the Company and its restricted subsidiaries’ ability to grant liens on the Company and its restricted subsidiaries’ assets, incur indebtedness, sell assets, make investments, engage in acquisitions, mergers or consolidations and pay certain dividends and other restricted payments. The Credit Facilities require the Company to comply with financial maintenance covenants to be tested quarterly, consisting of a maximum first-lien leverage ratio.
Subject to customary conditions and restrictions, the Company may obtain incremental term loans and/or revolving loans in an aggregate amount not to exceed (i) the greater of $550 million and 100% of EBITDA, plus (ii) the amount of all voluntary prepayments and commitment reductions under the Credit Facilities, plus (iii) additional amounts subject to certain leverage-based ratio tests.
The Credit Facilities also contain certain customary events of default, including, but not limited to: (i) failure to pay principal, interest, fees or other amounts under the Credit Facilities when due, taking into account any applicable grace period; (ii) any representation or warranty proving to have been incorrect in any material respect when made; (iii) failure to perform or observe covenants or other terms of the Credit Facilities subject to certain grace periods; (iv) a cross-default and cross-acceleration with certain other material debt; (v) bankruptcy events; (vi) certain defaults under ERISA; and (vii) the invalidity or impairment of security interests.
5.375% Senior Unsecured Notes
In April 2018, the Company issued $500 million of senior unsecured notes, which mature in 2026 and bear interest at a rate of 5.375% per year, for net proceeds of $493 million. Interest is payable semi-annually in arrears on October 15 and
April 15 of each year, commencing on October 15, 2018. The notes are redeemable in whole or in part at various times and premiums per their indenture, with the first call date of April 15, 2021 at a price of 102.688%. The Company used the net cash proceeds from the notes to reduce debt due to former Parent.
On April 15, 2021, the Company redeemed all of its $500 million 5.375% senior unsecured notes due 2026, which was primarily funded through cash on hand. Due to this redemption, the Company incurred an $18 million charge in the second quarter of 2021, including $13 million of call premiums and $5 million from the acceleration of deferred financing fees. Such charge is reported as early extinguishment of debt on the Consolidated Statements of Income/(Loss).
4.375% Senior Unsecured Notes
In August 2020, the Company issued $500 million of senior unsecured notes, which mature in 2028 and bear interest at a rate of 4.375% per year, for net proceeds of $492 million. Interest is payable semi-annually in arrears on February 15 and August 15 of each year, commencing on February 15, 2021. The notes are redeemable in whole or in part at various times and premiums per their indenture, with the first call date of August 15, 2023 at a price of 102.188%. The Company used the net cash proceeds from the notes to reduce the borrowings outstanding under its revolving credit facility.
Finance Leases
The Company’s finance leases primarily consist of the lease of its corporate headquarters. In connection with the Company’s separation from former Parent, it was assigned the lease for its corporate headquarters located in Parsippany, New Jersey from its former Parent, which resulted in the Company recording a finance lease obligation and asset.
Deferred Debt Issuance Costs
The Company classifies deferred debt issuance costs related to its revolving credit facility within other non-current assets on the Consolidated Balance Sheets. Such deferred debt issuance costs were $2 million and $4 million as of December 31, 2021 and 2020, respectively.
Cash Flow Hedge
In 2018, the Company hedged a portion of its $1.6 billion term loan. The pay-fixed/receive-variable interest rate swaps hedge $1.1 billion of the Company’s term loan interest rate exposure, of which $600 million expires in the second quarter of 2024 and has a weighted average fixed rate of 2.51% and $500 million expires in the fourth quarter of 2024 and has a weighted average fixed rate of 0.99%. The variable rates of the swap agreements are based on one-month LIBOR. The aggregate fair value of these interest rate swaps was a liability of $23 million and $71 million as of December 31, 2021 and 2020, respectively, which was included within other non-current liabilities on the Consolidated Balance Sheets. The effect of interest rate swaps on interest expense, net on the Consolidated Statements of Income/(Loss) were $26 million, $22 million and $3 million of expense during 2021, 2020 and 2019, respectively.
There was no hedging ineffectiveness recognized in 2021, 2020 or 2019. The Company expects to reclassify approximately $16 million of losses from AOCI to interest expense during the next 12 months.
Interest Expense, Net
The Company incurred interest expense of $94 million, $114 million and $104 million in 2021, 2020 and 2019, respectively. Cash paid related to such interest was $96 million, $101 million and $100 million for 2021, 2020 and 2019, respectively. Interest income was $1 million, $2 million and $4 million for 2021, 2020 and 2019, respectively.
The Company measures its financial assets and liabilities at fair value on a recurring basis and utilizes the fair value hierarchy to determine such fair values. Financial assets and liabilities carried at fair value are classified and disclosed in one of the following three categories:
Level 1: Quoted prices for identical instruments in active markets.
Level 2: Quoted prices for similar instruments in active markets; quoted prices for identical or similar instruments in markets that are not active; and model-derived valuations whose inputs are observable or whose significant value driver is observable.
Level 3: Unobservable inputs used when little or no market data is available. In certain cases, the inputs used to measure fair value may fall into different levels of the fair value hierarchy. In such cases, the level in the fair value hierarchy within which the fair value measurement falls has been determined based on the lowest level input (closest to Level 3) that is significant to the fair value measurement. The Company’s assessment of the significance of a particular input to the fair value measurement in its entirety requires judgment, and considers factors specific to the asset or liability.
The fair value of financial instruments is generally determined by reference to market values resulting from trading on a national securities exchange or in an over-the-counter market. In cases where quoted market prices are not available, fair value is based on estimates using present value or other valuation techniques, as appropriate. The carrying amounts of cash and cash equivalents, trade receivables, accounts payable and accrued expenses and other current liabilities approximate fair value due to the short-term maturities of these assets and liabilities. The carrying amounts and estimated fair values of all other financial instruments are as follows:
| | | | | | | | | | | |
| December 31, 2021 |
| Carrying Amount | | Estimated Fair Value |
| Debt | $ | 2,084 | | | $ | 2,100 | |
The Company estimates the fair value of its debt using Level 2 inputs based on indicative bids from investment banks or quoted market prices with the exception of finance leases, which are estimated at carrying value.
Financial Instruments
Changes in interest rates and foreign exchange rates expose the Company to market risk. The Company uses cash flow hedges as part of its overall strategy to manage its exposure to market risks associated with fluctuations in interest rates and foreign currency exchange rates. As a matter of policy, the Company only enters into transactions that it believes will be highly effective at offsetting the underlying risk, and it does not use derivatives for trading or speculative purposes. The Company estimates the fair value of its derivatives using Level 2 inputs.
Interest Rate Risk
A portion of debt used to finance the Company’s operations is exposed to interest rate fluctuations. The Company uses various hedging strategies and derivative financial instruments to create a desired mix of fixed and floating rate assets and liabilities. Derivative instruments currently used in these hedging strategies include interest rate swaps. The derivatives used to manage the risk associated with the Company’s floating rate debt are derivatives designated as cash flow hedges. See Note 12 - Long-Term Debt and Borrowing Arrangements for the impact of such cash flow hedges.
Foreign Currency Risk
The Company has foreign currency rate exposure to exchange rate fluctuations worldwide, particularly with respect to the Canadian Dollar, the Chinese Yuan, the Euro, the British Pound, the Brazilian Real and the Argentine Peso. The Company uses foreign currency forward contracts at various times to manage and reduce the foreign currency exchange rate risk associated with its foreign currency denominated receivables and payables, forecasted royalties and forecasted earnings and cash flows of foreign subsidiaries and other transactions. The Company recognized gains from freestanding foreign currency exchange contracts of $2 million during 2021 and losses of $3 million and $1 million during 2020 and 2019, respectively. Such gains or losses are included in operating expenses in the Consolidated Statements of Income/(Loss).
The Company accounts for Argentina as a highly inflationary economy. The Company incurred foreign currency exchange losses related to Argentina of $1 million, $2 million and $5 million during 2021, 2020 and 2019, respectively. Such losses are included in operating expenses in the Consolidated Statements of Income/(Loss).
Credit Risk and Exposure
The Company is exposed to counterparty credit risk in the event of nonperformance by counterparties to various agreements and sales transactions. The Company manages such risk by evaluating the financial position and creditworthiness of such counterparties and often by requiring collateral in instances in which financing is provided. The Company mitigates counterparty credit risk associated with its derivative contracts by monitoring the amounts at risk with each counterparty to such contracts, periodically evaluating counterparty creditworthiness and financial position, and where possible, dispersing its risk among multiple counterparties.
Market Risk
The Company is subject to risks relating to the geographic concentration of its hotel properties, which may result in the Company’s results of operations being more sensitive to local and regional economic conditions and other factors, including competition, natural disasters and economic downturns, than the Company’s results of operations would be, absent such geographic concentrations. Local and regional economic conditions and other factors may differ materially from prevailing conditions in other parts of the world. Excluding cost-reimbursement revenues, which are offset by cost-reimbursement expense, revenues from transactions in the states of Texas and Florida as a percent of U.S. revenues were approximately 10% and 18%, respectively, during 2021, 10% and 19%, respectively, during 2020 and 10% and 20%, respectively, during 2019. Revenues in the state of Florida include license and other fees from the Company’s former Parent. Excluding these revenues, revenues in the state of Florida as a percent of U.S. revenues were 12%, 9% and 10% during 2021, 2020 and 2019, respectively.
During 2021, 2020 and 2019 CorePoint accounted for 20%, 25% and 26%, respectively, of revenues. Excluding cost-reimbursement revenues, which are offset by cost-reimbursement expenses, CorePoint accounted for 8% during 2021 and 10% during both 2020 and 2019.
| | |
| 14. COMMITMENTS AND CONTINGENCIES |
Litigation
The Company is involved, at times, in claims, legal and regulatory proceedings and governmental inquiries arising in the ordinary course of its business, including but not limited to: breach of contract, fraud and bad faith claims with franchisees in connection with franchise agreements and with owners in connection with management contracts, as well as negligence, breach of contract, fraud, employment, consumer protection and other statutory claims asserted in connection with alleged acts or occurrences at owned, franchised or managed properties or in relation to guest reservations and bookings. The Company may also at times be involved in claims, legal and regulatory proceedings and governmental inquiries relating to bankruptcy proceedings involving efforts to collect receivables from a debtor in bankruptcy, employment matters, claims of infringement upon third parties’ intellectual property rights, claims relating to information security, privacy and consumer protection, fiduciary duty/trust claims, tax claims, environmental claims and landlord/tenant disputes. Along with many of its competitors, the Company and/or certain of its subsidiaries have been named as defendants in litigation matters filed in state and federal courts, alleging statutory and common law claims related to purported incidents of sex trafficking at certain franchised and managed hotel facilities. These matters are in the pleading or discovery stages at this time. As of December 31, 2021, the Company is aware of approximately 35 pending matters filed naming the Company and/or subsidiaries. Based upon the status of these matters, the Company has not made a determination as to the likelihood of loss of any one of these matters and is unable to estimate a range of losses at this time.
The Company records an accrual for legal contingencies when it determines, after consultation with outside counsel, that it is probable that a liability has been incurred and the amount of the loss can be reasonably estimated. In making such determinations, The Company evaluates, among other things, the degree of probability of an unfavorable outcome, and when it is probable that a liability has been incurred, its ability to make a reasonable estimate of loss. The Company reviews these accruals each reporting period and makes revisions based on changes in facts and circumstances, including changes to its strategy in dealing with these matters.
The Company believes that it has adequately accrued for such matters with reserves of $6 million and $4 million as of December 31, 2021 and 2020, respectively. The Company also had receivables of $3 million as of December 31, 2021 and immaterial receivables as of December 31, 2020, for certain matters which are covered by insurance and were included in other current assets on its Consolidated Balance Sheets. Litigation is inherently unpredictable and, although the Company believes that its accruals are adequate and/or that it has valid defenses in these matters, unfavorable results could occur. As such, an adverse outcome from such proceedings for which claims are awarded in excess of the amounts accrued, if any, could be material to the Company with respect to earnings and/or cash flows in any given reporting period. As of December 31, 2021, the potential exposure resulting from adverse outcomes of such legal proceedings could, in the aggregate, range up to approximately $5 million in excess of recorded accruals. However, the Company does not believe that the impact of such litigation will result in a material liability to the Company in relation to its combined financial position or liquidity.
Guarantees
Hotel-management guarantees
The Company had previously entered into hotel-management agreements that provide the hotel owner with a guarantee of a certain level of profitability based upon various metrics. Under such agreements, the Company was required to compensate the hotel owner for any profitability shortfall over the life of the management agreement up to a specified aggregate amount. For certain agreements, the Company may have been able to recapture all or a portion of the shortfall payments in the event that future operating results exceed targets.
As a result of COVID-19, on June 30, 2020, the Company provided notice of termination of its one remaining hotel performance guarantee pursuant to a force majeure provision in the hotel-management agreement. The notice provides for termination of the management agreement as of the 90th day following the notice date. Such termination has not yet occurred as the hotel’s owner and the Company are engaged in alternate dispute resolution. As a result of the Company’s notice of termination of the management agreement, the Company’s receivable of $4 million became fully impaired as of June 30, 2020 with the charge recorded within impairments, net on the Consolidated Statements of Income/(Loss). As of December 31, 2021, the Company had no other hotel-management guarantee contracts.
Separation-Related Guarantees
The Company assumed one-third of certain contingent and other corporate liabilities of former Parent incurred prior to the spin-off, including liabilities of former Parent related to, arising out of or resulting from certain terminated or divested businesses, certain general corporate matters of former Parent and any actions with respect to the separation plan or the distribution made or brought by any third party.
Credit Support Provided and Other Indemnifications Relating to former Parent’s Sale of its European Vacation Rentals Business
In May 2018, former Parent completed the sale of its European Vacation Rentals business to Compass IV Limited, an affiliate of Platinum Equity, LLC (“Buyer”). In connection with the sale of the European Vacation Rentals business, the Company provided certain post-closing credit support in the form of guarantees to help ensure that the business meets the requirements of certain credit card service providers, travel association and regulatory authorities. Such post-closing credit support may be enforced or called upon if the European vacation rentals business fails to meet its primary obligation to pay certain amounts when due. The European vacation rentals business has provided an indemnity to former Parent in the event that the post-closing credit support is enforced or called upon.
Pursuant to the terms of the Separation and Distribution Agreement that was entered into in connection with the Company’s spin-off, the Company will assume one-third and former Parent will assume two-thirds of losses that may be incurred by former Parent or the Company in the event that these credit support arrangements are enforced or called upon by any beneficiary in respect of any indemnification claims made.
The table below summarizes the post-closing credit support guarantees related to the sale of the European Vacation Rentals business, the fair values of such guarantees and the receivables from its former Parent representing two-thirds of such guarantees at December 31, 2021:
| | | | | | | | | | | | | | | | | |
| Guarantees | | Fair Value of Guarantees | | Receivable from former Parent |
| Post-closing credit support at time of sale | $ | 81 | | | $ | 39 | | | $ | 26 | |
| Additional post-closing credit support | 46 | | | 22 | | | 15 | |
| Total | $ | 127 | | | $ | 61 | | | $ | 41 | |
The fair value of the guarantees were $61 million as of December 31, 2021 and 2020 and were included in other non-current liabilities on the Consolidated Balance Sheets. In connection with these guarantees the Company had receivables from its former Parent of $41 million as of December 31, 2021 and 2020, which were included in other non-current assets on its Consolidated Balance Sheets.
| | |
| 15. STOCK-BASED COMPENSATION |
The Company has a stock-based compensation plan available to grant non-qualified stock options, incentive stock options, stock-settled appreciation rights (“SSARs”), RSUs, performance-vesting restricted stock units (“PSUs”) and/or other stock-based awards to key employees and non-employee directors. Under the Wyndham Hotels & Resorts, Inc. 2018 Equity and Incentive Plan (“Stock Plan”), which became effective on May 14, 2018, a maximum of 10.0 million shares of common stock may be awarded. As of December 31, 2021, 5.4 million shares remained available.
Incentive Equity Awards Granted by the Company
The activity related to the Company’s incentive equity awards for the year ended December 31, 2021 consisted of the following:
| | | | | | | | | | | | | | | | | | | | | | | |
| RSUs | | PSUs |
| Number of
RSUs | | Weighted
Average
Grant Price | | Number
of
PSUs | | Weighted
Average
Grant Price |
| Balance as of December 31, 2020 | 0.9 | | | $ | 54.15 | | | 0.2 | | | $ | 52.93 | |
Granted (a) | 0.7 | | | 65.75 | | | 0.1 | | | 65.21 | |
Vested | (0.3) | | | 54.76 | | | — | | | — | |
Canceled | (0.1) | | | 57.34 | | | — | | | — | |
| Balance as of December 31, 2021 | 1.2 | | (b) | $ | 60.37 | | | 0.3 | | (c) | $ | 57.51 | |
_____________________
(a)Represents awards granted by the Company primarily in February 2021.
(b)RSUs outstanding as of December 31, 2021 are expected to vest over time and have an aggregate unrecognized compensation expense of $51 million, which is expected to be recognized over a weighted average period of 2.4 years.
(c)PSUs outstanding as of December 31, 2021 are expected to vest over time and have an aggregate maximum potential unrecognized compensation expense of $14 million, which may be recognized over a weighted average period of 1.2 years based on attainment of targets.
The activity related to stock options granted by the Company for the year ended December 31, 2021 consisted of the following:
| | | | | | | | | | | | | | | | | | | | | | | |
| Number of Options | | Weighted Average Exercise Price | | Weighted Average Remaining Contractual Life (Years) | | Aggregate Intrinsic Value (in millions) |
| Outstanding as of December 31, 2020 | 1.4 | | | $ | 55.57 | | | | | |
Granted | 0.1 | | | 65.21 | | | | | |
| Exercised | (0.3) | | | 56.32 | | | | | |
| Canceled | (0.1) | | | 56.02 | | | | | |
Outstanding as of December 31, 2021 | 1.1 | | | $ | 56.04 | | | 4.6 | | $ | 38 | |
Unvested as of December 31, 2021 | 0.7 | | (a) | $ | 55.47 | | | 4.8 | | $ | 23 | |
Exercisable as of December 31, 2021 | 0.4 | | | $ | 56.89 | | | 4.3 | | $ | 15 | |
_____________________
(a)Unvested options as of December 31, 2021 are expected to vest over time and have an aggregate unrecognized compensation expense of $5 million, which will be recognized over a weighted average period of 1.9 years.
The fair value of stock options granted by the Company were estimated on the date of the grant using the Black-Scholes option-pricing model with the relevant assumptions outlined in the table below. Expected volatility is based on both historical and implied volatilities of the stock of comparable companies over the estimated expected life of the options. The expected life represents the period of time the options are expected to be outstanding. The risk-free interest rate is based on yields on U.S. Treasury strips with a maturity similar to the estimated expected life of the options. The projected dividend yield was based on the Company’s anticipated annual dividend divided by the price of the Company’s stock on the date of the grant.
| | | | | | | | | | | | | | | | | |
| 2021 | | 2020 | | 2019 |
| Grant date fair value | $19.58 | | $8.59 | | $10.46 |
| Grant date strike price | $65.21 | | $53.40 | | $52.44 |
| Expected volatility | 40.18% | | 24.30% | | 22.24% |
| Expected life | 4.25 years | | 4.25 years | | 6.25 years |
| Risk-free interest rate | 0.40% | | 1.21% | | 2.63% |
| Projected dividend yield | 0.98% | | 2.40% | | 2.21% |
Stock-Based Compensation Expense
Stock-based compensation expense was $28 million, $21 million and $20 million for 2021, 2020 and 2019, respectively. In 2020 and 2019, $2 million and $1 million, respectively was recorded within restructuring costs on the Consolidated Statements of Income/(Loss). Further for 2019, $4 million was recorded within separation-related costs on the Consolidated Statements of Income/(Loss).
The reportable segments presented below represent the Company’s operating segments for which separate financial information is available and is utilized on a regular basis by its chief operating decision maker to assess performance and allocate resources. In identifying its reportable segments, the Company also considers the nature of services provided by its operating segments. Management evaluates the operating results of each of its reportable segments based upon net revenues and “adjusted EBITDA”, which is defined as net income/(loss) excluding net interest expense, depreciation and amortization, early extinguishment of debt charges, impairment charges, restructuring and related charges, contract termination costs, transaction-related items (acquisition-, disposition- or separation-related), foreign currency impacts of highly inflationary countries, stock-based compensation expense, income taxes and development advance notes amortization. The Company believes that adjusted EBITDA is a useful measure of performance for its segments which, when considered with U.S. GAAP measures, allows a more complete understanding of its operating performance. The Company uses this measure internally to assess operating performance, both absolutely and in comparison to other companies, and to make day to day operating decisions, including in the evaluation of selected compensation decisions. The Company’s presentation of adjusted EBITDA may not be comparable to similarly-titled measures used by other companies. During the first quarter of 2021, the Company modified the definition of adjusted EBITDA to exclude the amortization of development advance notes to reflect how the Company’s chief operating decision maker reviews operating performance beginning in 2021. The Company has applied the modified definition of adjusted EBITDA to all periods presented.
| | | | | | | | | | | | | | | | | | | | | | | |
| Hotel Franchising | | Hotel Management | | Corporate and Other (a) | | Total |
Year Ended or as of December 31, 2021 | | | | | | | |
Net revenues | $ | 1,099 | | | $ | 466 | | | $ | — | | | $ | 1,565 | |
Adjusted EBITDA | 592 | | | 57 | | | (59) | | | 590 | |
Depreciation and amortization | 60 | | | 26 | | | 9 | | | 95 | |
Segment assets | 3,575 | | | 394 | | | 300 | | | 4,269 | |
Capital expenditures | 30 | | | 4 | | | 3 | | | 37 | |
| | | | | | | |
Year Ended or as of December 31, 2020 | | | | | | | |
Net revenues | $ | 863 | | | $ | 437 | | | $ | — | | | $ | 1,300 | |
Adjusted EBITDA (b) | 392 | | | 13 | | | (69) | | | 336 | |
Depreciation and amortization | 63 | | | 25 | | | 10 | | | 98 | |
Segment assets | 3,629 | | | 418 | | | 597 | | | 4,644 | |
Capital expenditures | 24 | | | 4 | | | 5 | | | 33 | |
| | | | | | | |
Year Ended or as of December 31, 2019 | | | | | | | |
Net revenues | $ | 1,279 | | | $ | 768 | | | $ | 6 | | | $ | 2,053 | |
Adjusted EBITDA (b) | 629 | | | 66 | | | (74) | | | 621 | |
Depreciation and amortization | 72 | | | 26 | | | 11 | | | 109 | |
Segment assets | 3,817 | | | 500 | | | 216 | | | 4,533 | |
Capital expenditures | 35 | | | 8 | | | 7 | | | 50 | |
_____________________
(a) Includes the elimination of transactions between segments.
(b) Adjusted EBITDA for 2020 and 2019 has been recasted to conform with the current year presentation.
Provided below is a reconciliation of net income/(loss) to adjusted EBITDA.
| | | | | | | | | | | | | | | | | |
| Year Ended December 31, |
| 2021 | | 2020 (a) | | 2019 (a) |
| Net income/(loss) | $ | 244 | | | $ | (132) | | | $ | 157 | |
| Provision for/(benefit from) income taxes | 91 | | | (26) | | | 50 | |
| Depreciation and amortization | 95 | | | 98 | | | 109 | |
| Interest expense, net | 93 | | | 112 | | | 100 | |
| Early extinguishment of debt | 18 | | | — | | | — | |
| Stock-based compensation expense | 28 | | | 19 | | | 15 | |
| Development advance notes amortization | 11 | | | 9 | | | 8 | |
| Impairments, net | 6 | | | 206 | | | 45 | |
| Separation-related expenses | 3 | | | 2 | | | 22 | |
| Restructuring costs | — | | | 34 | | | 8 | |
| Transaction-related expenses, net | — | | | 12 | | | 40 | |
| Contract termination costs | — | | | — | | | 42 | |
| Transaction-related item | — | | | — | | | 20 | |
| Foreign currency impact of highly inflationary countries | 1 | | | 2 | | | 5 | |
Adjusted EBITDA | $ | 590 | | | $ | 336 | | | $ | 621 | |
_____________________(a) Adjusted EBITDA for 2020 and 2019 has been recasted to conform with the current year presentation.
The geographic segment information provided below is classified based on the geographic location of the Company’s subsidiaries.
| | | | | | | | | | | | | | | | | |
| United States | | All Other Countries (a) | | Total |
| Year Ended or As of December 31, 2021 | | | | | |
| Net revenues | $ | 1,366 | | | $ | 199 | | | $ | 1,565 | |
| Net long-lived assets | 3,199 | | | 107 | | | 3,306 | |
| | | | | |
| Year Ended or As of December 31, 2020 | | | | | |
| Net revenues | $ | 1,159 | | | $ | 141 | | | $ | 1,300 | |
| Net long-lived assets | 3,334 | | | 184 | | | 3,518 | |
| | | | | |
| Year Ended or As of December 31, 2019 | | | | | |
| Net revenues | $ | 1,805 | | | $ | 248 | | | $ | 2,053 | |
| Net long-lived assets | 3,619 | | | 173 | | | 3,792 | |
_____________________
(a) Includes U.S. territories.
| | |
| 17. OTHER EXPENSES AND CHARGES |
Impairments, Net
During the fourth quarter of 2021, the Company’s Board approved a plan to sell its two owned hotels. As a result of the Board approval, the Company evaluated the recoverability of its owned hotels long-lived assets and in the fourth quarter of 2021, the Company recorded a $6 million impairment charge which was reported within impairments, net on the Consolidated Statement of Income/(Loss). For more information, see Note 6 - Assets and Liabilities Held for Sale.
As a result of COVID-19 and the significant negative impact it has had on travel demand during 2020, the Company reviewed its intangible assets for potential impairment and determined that the carrying value of certain intangible assets were in excess of their fair values. Accordingly, the Company recorded impairment charges of $205 million, in 2020, primarily related to certain trademarks and goodwill associated with its owned hotel reporting unit. See Note 8 - Intangible Assets for more information. Additionally, in 2020, the Company incurred a $4 million non-cash impairment charge for the
write-off of a receivable as a result of the Company’s notice of termination of an unprofitable management agreement. See Note 14 - Commitments and Contingencies for more information. In 2020, the Company also received $3 million of cash related to a previously impaired asset. These charges were all reported within impairments, net on the Consolidated Statement of Income/(Loss).
During 2019, the Company incurred a non-cash net impairment charge of $45 million associated with the termination of a hotel-management arrangement which contained operating performance guarantees and covered 22 hotel properties. The charge is comprised of a $48 million write-off of receivables, a $10 million write-off of a guarantee asset and the derecognition of a $13 million guarantee liability.
Separation-Related
The Company incurred separation-related costs associated with its spin-off from former Parent of $3 million, $2 million and $22 million during 2021, 2020 and 2019, respectively. During 2021 these costs primarily consisted of legal and tax-related costs. During 2020 and 2019 these costs primarily consisted of severance and other employee-related costs.
Restructuring
The Company did not incur restructuring charges during 2021. Below is the activity for the year ended December 31, 2021 relating to all four of the Company’s restructuring plans implemented in 2020:
| | | | | | | | | | | | | | | | | | | |
| | | 2021 Activity | | | | |
| Liability as of December 31, 2020 | | Cash Payments | | | | Liability as of December 31, 2021 |
| Personnel-related | $ | 7 | | | $ | (7) | | | | | $ | — | |
| Facility-related | 3 | | | (3) | | | | | — | |
| Total accrued restructuring | $ | 10 | | | $ | (10) | | | | | $ | — | |
The Company incurred $34 million of charges during 2020, related to four restructuring initiatives implemented in response to COVID-19. Such plans resulted in a reduction of 846 employees during 2020. In addition, during 2019, the Company had implemented restructuring initiatives, primarily focused on enhancing its organizational efficiency and rationalizing its operations, as discussed below.
Restructuring charges by segment for the year ended December 31, 2020 were as follows:
| | | | | |
| Year Ended December 31, 2020 |
| Hotel Franchising | $ | 15 | |
| Hotel Management | 3 | |
| Corporate and Other | 16 | |
| Total | $ | 34 | |
The following table presents activity for the year ended December 31, 2020 relating to restructuring activities by plan:
| | | | | | | | | | | | | | | | | | | | | | | | | | | | | |
| | | 2020 Activity | | |
| Liability as of December 31, 2019 | | Costs Recognized | | Cash Payments | | Other (a) | | Liability as of December 31, 2020 |
| 2019 Plan | | | | | | | | | |
| Personnel-related | $ | 8 | | | $ | — | | | $ | (7) | | | $ | (1) | | | $ | — | |
| 2020 Plans | | | | | | | | | |
| Personnel-related | — | | | 28 | | | (20) | | | (1) | | | 7 | |
| Facility-related | — | | | 5 | | | (2) | | | — | | | 3 | |
| Other | — | | | 1 | | | (1) | | | — | | | — | |
| Total 2020 Plans | — | | | 34 | | | (23) | | | (1) | | | 10 | |
| Total accrued restructuring | $ | 8 | | | $ | 34 | | | $ | (30) | | | $ | (2) | | | $ | 10 | |
_____________________
(a)Represents non-cash payments in Company stock.
During 2019, the Company recorded $8 million of charges related to restructuring initiatives, primarily focused on enhancing its organizational efficiency and rationalizing its operations. These initiatives resulted in a reduction of 58 employees and were comprised of employee separation costs. The charges were recorded primarily to the Corporate and Other segment. During 2019, the Company made no material cash payments related to this initiative.
Transaction-Related, Net
There were no transaction-related expenses incurred during the year ended December 31, 2021.
The Company incurred $12 million of transaction-related expenses during the year ended December 31, 2020, which were primarily related to integration activities for the acquisition of La Quinta.
The Company incurred $40 million of transaction-related expenses during the year ended December 31, 2019, which were primarily related to integration activities for the acquisition of La Quinta and includes $7 million associated with the resolution of certain tax matters discussed below.
Contract Termination
During 2019, the Company incurred contract termination charges of $42 million. The Company entered into an agreement to terminate a hotel-management agreement which contained operating performance guarantees and covered eight hotel properties. In conjunction with this termination, the Company incurred a contract termination charge of $34 million. In addition, the Company incurred a contract termination charge of $8 million in connection with an indemnification obligation associated with the termination of a hotel-management agreement and an associated lease. As of December 31, 2019, the Company had an $8 million liability related to such charge which was included in accrued expenses and other current liabilities on its Consolidated Balance Sheet and was subsequently paid in 2020.
CorePoint Agreement
In October 2019, the Company entered into an agreement with CorePoint, a franchisee with which the Company also has hotel-management agreements, to resolve open issues between the two companies. As part of the agreement, the Company recorded a $20 million fee credit for past services in 2019, representing payments Wyndham is required to make to CorePoint pursuant to the agreement. Such charge is reflected as a reduction to hotel management revenues on the Consolidated Statements of Income/(Loss). In addition, the two companies also agreed to finalize outstanding tax matters related to Wyndham’s acquisition of La Quinta. As a result, Wyndham also recorded a $7 million charge in 2019 related to the resolution of the tax matters, which is reflected in transaction-related costs on the Consolidated Statements of Income/(Loss). The Company paid $2 million, $7 million and $18 million to CorePoint in 2021, 2020 and 2019, respectively, related to such charges.
| | |
| 18. TRANSACTIONS WITH FORMER PARENT |
The Company has a number of arrangements with its former Parent for services provided between both parties as described below.
License Agreement and Other Agreements with Former Parent
In connection with the Company’s spin-off, the Company and former Parent entered into long-term exclusive license agreements to retain former Parents’ affiliations with one of the hospitality industry’s top-rated loyalty programs, Wyndham Rewards, as well as to continue to collaborate on inventory-sharing and customer cross-sell initiatives.
The Company also entered into several agreements with former Parent that govern the relationship of the parties following the spin-off, including a separation and distribution agreement, an employee matters agreement, a tax matters agreement and a transition services agreement. There were no revenues recorded in connection with these agreements during 2021 or 2020. During 2019, the Company recorded revenues in connection with these agreements of $6 million, which are reported within other revenues on the Consolidated Statements of Income/(Loss).
In connection with the Company’s license, development and non-competition agreement, the Company recorded revenues from former Parent in the amounts of $65 million during both 2021 and 2020 and $106 million during 2019. Further, the Company recorded revenues of $9 million, $13 million and $18 million during 2021, 2020 and 2019, respectively, for activities associated with the Wyndham Rewards program. The Company also recorded revenues from a former affiliate for license fees of $5 million, $6 million and $7 million during 2021, 2020 and 2019, respectively. Such fees are recorded within license and other fees on the Consolidated Statements of Income/(Loss). The Company also incurred $8 million of expense during 2019 as a result of an indemnification obligation to former Parent related to the termination of a hotel-management agreement and an associated lease. Such expense is reported within contract termination costs on the Consolidated Statement of Income/(Loss).
Transfer of Former Parent Liabilities and Issuances of Guarantees to Former Parent and Affiliates
Upon the distribution of the Company’s common stock to former Parent stockholders, the Company entered into certain guarantee commitments with its former Parent. These guarantee arrangements relate to certain former Parent contingent tax and other corporate liabilities. The Company assumed and is responsible for one-third of such contingent liabilities while its former Parent is responsible for the remaining two-thirds. The amount of liabilities assumed by the Company in connection with the spin-off was $18 million as of both December 31, 2021 and 2020, which were included within other non-current liabilities on its Consolidated Balance Sheets. The Company also had a $5 million and $3 million liability due to its former Parent which was included within accrued expenses and other current liabilities on its Consolidated Balance Sheets as of December 31, 2021 and 2020, respectively. In addition, the Company had $4 million of receivables due from former Parent as of both December 31, 2021 and 2020, which were included within current assets on its Consolidated Balance Sheets. During 2019, the Company received $28 million from its former Parent related to net tax refunds, which was included within capital contribution from former Parent on its Consolidated Statement of Cash Flows.
Former Parent’s Sale of its European Vacation Rentals Business
In connection with the sale of the European Vacation Rentals business, the Company was entitled to one-third of the excess of net proceeds from the sale above a pre-set amount. During 2019, the Buyer notified former Parent of certain proposed post-closing adjustments of approximately $44 million which could serve to reduce the net consideration received from the sale of the European Vacation Rentals business. On December 13, 2021, former Parent entered into a settlement agreement, contingent upon regulatory approval, to settle the post-closing adjustment claims which will be split one-third and two-thirds between the Company and former Parent, respectively. As of December 31, 2021, the Company had a $2 million reserve for such settlement.
The Company adopted the new accounting guidance for leases using the modified retrospective approach as of January 1, 2019. Prior-year financial statements were not recast under the new standard, and therefore those amounts are not presented in the tables below. The Company elected the package of transition provisions available for expired or existing contracts, which allowed the Company to carry forward its historical assessments of (i) whether contracts are or contain leases, (ii) lease classification and (iii) initial direct costs.
The Company leases property and equipment under finance and operating leases. For leases with terms greater than one year, the Company records the related asset and obligation at the present value of lease payments over the term. The Company does not separate lease and nonlease components of equipment leases.
The table below presents the lease-related assets and liabilities recorded on the Consolidated Balance Sheets.
| | | | | | | | | | | | | | | | | | | | |
| | Classification on the Balance Sheets | | December 31, 2021 | | December 31, 2020 |
| Assets | | | | | | |
| Operating lease assets | | Other non-current assets | | $ | 14 | | | $ | 14 | |
| Finance lease assets | | Property and equipment, net | | 29 | | | 33 | |
| Total lease assets | | | | $ | 43 | | | $ | 47 | |
| | | | | | |
| Liabilities | | | | | | |
| Current | | | | | | |
| Operating lease liabilities | | Accrued expenses and other current liabilities | | $ | 4 | | | $ | 4 | |
| Finance lease liabilities | | Current portion of long-term debt | | 5 | | | 5 | |
| Non-current | | | | | | |
| Operating lease liabilities | | Other non-current liabilities | | 10 | | | 11 | |
| Finance lease liabilities | | Long-term debt | | 45 | | | 50 | |
| Total lease liabilities | | | | $ | 64 | | | $ | 70 | |
The table below presents the remaining lease term and discount rates for finance and operating leases.
| | | | | | | | | | | | | | |
| | December 31, 2021 | | December 31, 2020 |
| Weighted-average remaining lease term | | | | |
| Operating leases | | 4.7 years | | 5.5 years |
| Finance leases | | 7.7 years | | 8.7 years |
| Weighted-average discount rate | | | | |
| Operating leases | | 3.9 | % | | 4.2 | % |
| Finance leases | | 4.3 | % | | 4.3 | % |
Undiscounted Cash Flows
The table below reconciles the undiscounted cash flows for each of the first five years and total of the remaining years to the finance lease liabilities and operating lease liabilities recorded on the Company’s Consolidated Balance Sheet as of December 31, 2021.
| | | | | | | | | | | |
| Operating Leases | | Finance Leases |
| 2022 | $ | 4 | | | $ | 7 | |
| 2023 | 4 | | | 7 | |
| 2024 | 3 | | | 8 | |
| 2025 | 1 | | | 8 | |
| 2026 | 1 | | | 8 | |
| Thereafter | 2 | | | 21 | |
| Total minimum lease payments | 15 | | | 59 | |
| Less: amount of lease payments representing interest | 1 | | | 9 | |
| Present value of future minimum lease payments | 14 | | | 50 | |
| Less: current obligations under leases | 4 | | | 5 | |
| Long-term lease obligations | $ | 10 | | | $ | 45 | |
Other Information
Under the new accounting standard for leases, the Company recorded the following related to leases on the Consolidated Financial Statements:
| | | | | | | | | | | |
Consolidated Statements of Cash Flows: | Year Ended December 31, |
| 2021 | | 2020 |
Operating activities | | | |
| Cash payments related to operating and finance leases | $ | 7 | | | $ | 8 | |
| Financing activities | | | |
| Cash payments related to finance leases | 5 | | | 5 | |
| | | | | | | | | | | |
Consolidated Statements of Income/(Loss): | Year Ended December 31, |
| 2021 | | 2020 |
| Operating lease expense | $ | 4 | | | $ | 5 | |
| Finance lease expense | | | |
| Amortization of right-of-use assets | 4 | | | 4 | |
| Interest expense | 2 | | | 2 | |
| | |
| 20. ACCUMULATED OTHER COMPREHENSIVE INCOME/(LOSS) |
The components of AOCI are as follows:
| | | | | | | | | | | | | | | | | |
| Net of Tax | Foreign Currency Translation Adjustments | | Cash Flow Hedges | | Accumulated Other Comprehensive Income/(Loss) |
| Balance as of December 31, 2018 | $ | (4) | | | $ | (4) | | | $ | (8) | |
| Period change | 3 | | | (22) | | | (19) | |
| Balance as of December 31, 2019 | $ | (1) | | | $ | (26) | | | $ | (27) | |
| Period change | 3 | | | (28) | | | (25) | |
| Balance as of December 31, 2020 | $ | 2 | | | $ | (54) | | | $ | (52) | |
| Period change | — | | | 37 | | | 37 | |
| Balance as of December 31, 2021 | $ | 2 | | | $ | (17) | | | $ | (15) | |
| | |
| 21. DEFINED CONTRIBUTION BENEFIT PLANS |
The Company administers and maintains its own defined contribution savings plans and deferred compensation plan. The Company’s cost for these plans was $10 million during 2021, 2020 and 2019.
EXHIBIT INDEX
| | | | | |
| Exhibit No. | Description |
| 2.1 | |
| 2.2 | |
| 3.1 | |
| 3.2 | |
| 4.1 | |
| 4.2 | |
| 4.3 | |
| 4.4 | |
| 4.5 | |
| 4.6 | |
| 4.7 | |
| 4.8* | |
| 10.1 | |
| 10.2 | |
| 10.3 | |
| 10.4 | License, Development and Noncompetition Agreement, dated as of May 31, 2018, among Wyndham Destinations, Inc. (now known as Travel + Leisure Co.), Wyndham Hotels and Resorts, LLC, Wyndham Hotels & Resorts, Inc., Wyndham Hotel Group Europe Limited, Wyndham Hotel Hong Kong Co. Limited, and Wyndham Hotel Asia Pacific Co. Limited (incorporated by reference to Exhibit 10.4 to the Registrant’s Form 8-K filed June 4, 2018) |
| 10.5 | Credit Agreement, dated as of May 30, 2018, among Wyndham Hotels & Resorts, Inc., the guarantors party thereto from time to time, Bank of America, N.A., as Administrative and Collateral Agent, and the lenders party thereto (incorporated by reference to Exhibit 10.1 to the Registrant’s Form 8-K filed May 31, 2018) |
| 10.6 | First Amendment, dated as of April 30, 2020, to the Credit Agreement, dated as of May 30, 2018, among Wyndham Hotels & Resorts, Inc., the several lenders and letter of credit issuers from time to time party thereto, Bank of America, N.A., as administrative agent, and the other parties thereto (incorporated by reference to Exhibit 10.1 to the Registrant’s Form 8-K filed May 4, 2020) |
| 10.7 | Second Amendment, dated as of August 10, 2020 to the Credit Agreement, dated as of May 30, 2018, as amended by the First Amendment, dated as of April 30, 2020, with Bank of America, N.A., as administrative agent, the several lenders from time to time party thereto, and the other parties thereto (incorporated by reference to Exhibit 10.1 to the Registrant’s Form 8-K filed August 11, 2020) |
| 10.8 | |
| 10.9 | |
| 10.10 | |
| 10.11 | |
| | | | | |
| 10.12 | |
| 10.13 | |
| 10.14 | |
| 10.15 | |
| 10.16 | |
| 10.17 | |
| 10.18 | |
| 10.19 | |
| 10.20 | |
| 10.21* | |
| 10.22 | |
| 10.23 | |
| 10.24 | |
| 10.25 | |
| 10.26 | |
| 10.27 | |
| 21.1* | |
| 23.1* | |
| 31.1* | |
| 31.2* | |
| 32** | |
| 101.INS | XBRL Instance Document - the instance document does not appear in the Interactive Data File because its XBRL tags are embedded within the Inline XBRL document |
| 101.SCH* | XBRL Taxonomy Extension Schema Document |
| 101.CAL* | XBRL Taxonomy Extension Calculation Linkbase Document |
| 101.DEF* | XBRL Taxonomy Extension Definition Linkbase Document |
| 101.LAB* | XBRL Taxonomy Extension Label Linkbase Document |
| 101.PRE* | XBRL Taxonomy Extension Presentation Linkbase Document |
| 104 | Cover Page Interactive Data File - the cover page interactive data file does not appear in the Interactive Data File because its XBRL tags are embedded within the Inline XBRL document |
______________________
* Filed herewith.
** Furnished with this report.